Monday Color - 8 Straight 1%-ers, Large Calls, Corrections, Gold Buyers, Emerging Momentum

Here's what's piquing my interest on another tough start to a week.
Lots Of Wiggles
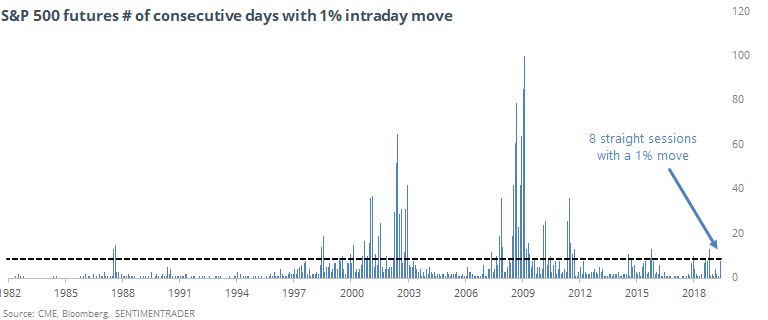
The Financial Times notes that this has been a particularly jarring time for traders, with now 8 straight sessions undergoing at least a 1% intraday change in the S&P 500. Historically, this is a long streak but (of course) it went much longer during the prolonged bear markets.
What we typically see during times like this is some version of the argument that a jump in volatility so soon after a new high suggests a change in trend. That has been a cliche for decades, but has been hard to prove using empirical evidence.
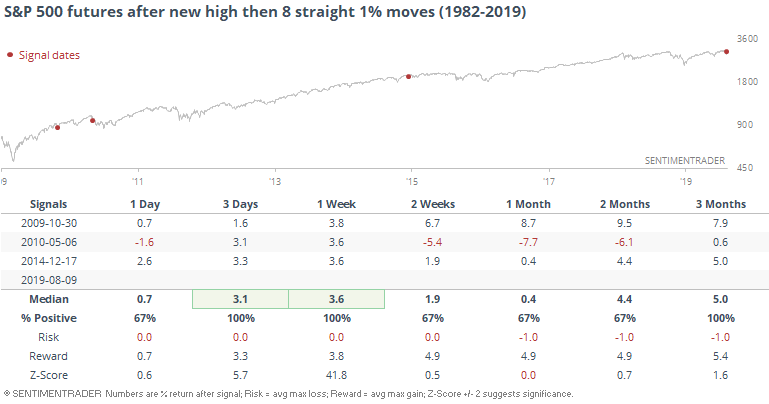
It never happened prior to the financial crisis. Since then, it led to immediate rallies, one of which rolled over to a lower low.
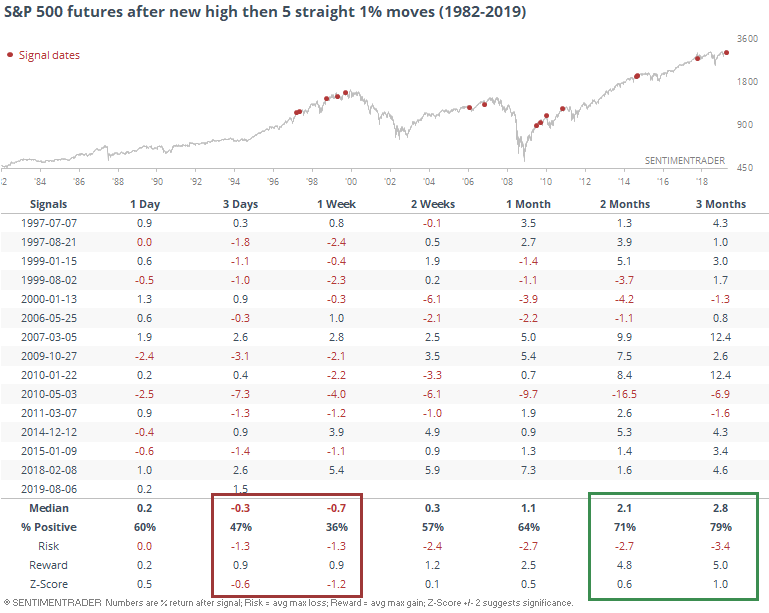
If we relax the parameters to get a larger sample size and only look for a streak of 5 straight 1% moves, then there is a little stronger case for short-term weakness, but few of them persisted beyond the next couple of weeks.
Trader Behavior
Last week's volatility triggered relative apathy among options traders. The smallest of traders didn't adjust their behavior much, only modestly reducing their speculative call buying and raising protective put purchases. One would think that kind of volatility would cause them more strife, but apparently not.
Their optimism remains relatively high, which is a concern. Oddly, though, the largest options traders reduced their call buying by quite a lot. Usually the two sets of traders move more in line with each other.
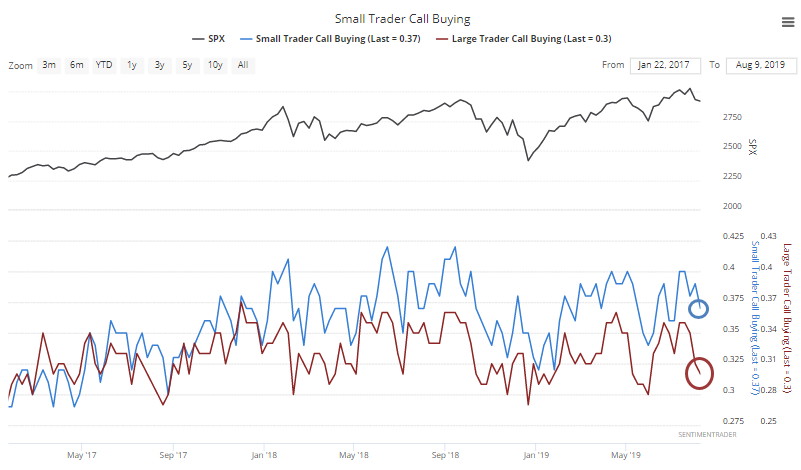
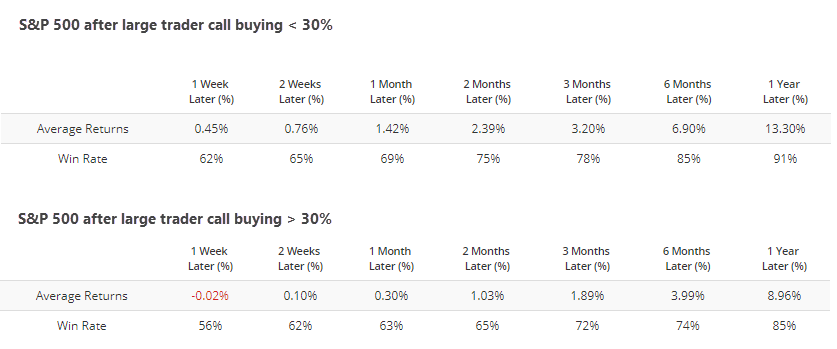
At about 30% of total volume, large traders' call buying activity is somewhat subdued. The S&P has fared better following weeks when their call buying was below 30% than above 30%, but it wasn't a drastic difference according to the Backtest Engine.
NOTE: Eric has added a "Parameter URL" box to the Backtest Engine. This now allows you to copy and share the exact parameters of any backtest with another user.
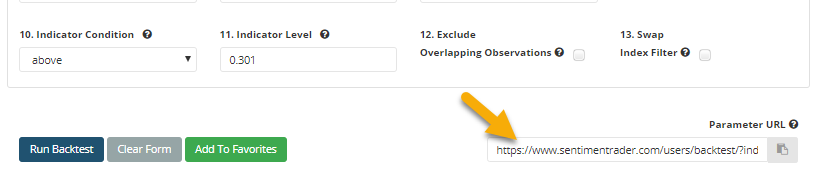
So, if you click this link, it should pop up the exact inputs I used for the test above with large trader call buying. All you have to do is click the Run Backtest button then the Multi-Timeframe Results tab to see the S&P's returns over different time frames.
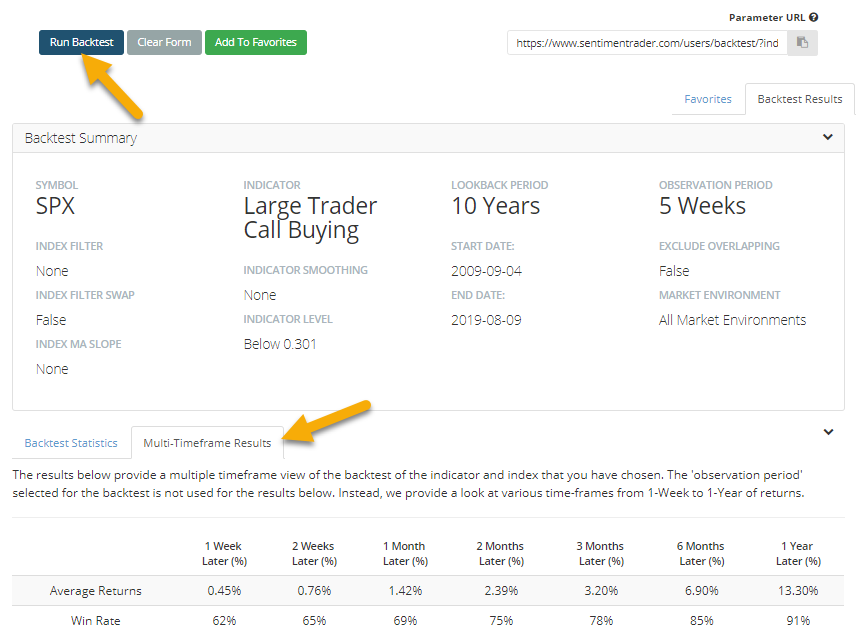
The Engine is a fantastic tool that allows anyone to test virtually every indicator we carry against a variety of indexes and ETFs, without having to rely on anyone's opinions or cherry-picked examples.
As a result of the drop in large traders' call buying and uptick in their put purchases, their put/call ratio has jumped to 1, meaning they bought as many puts as calls last week.
That has been a decent sign for stocks going forward since the financial crisis (click here to run the same test).
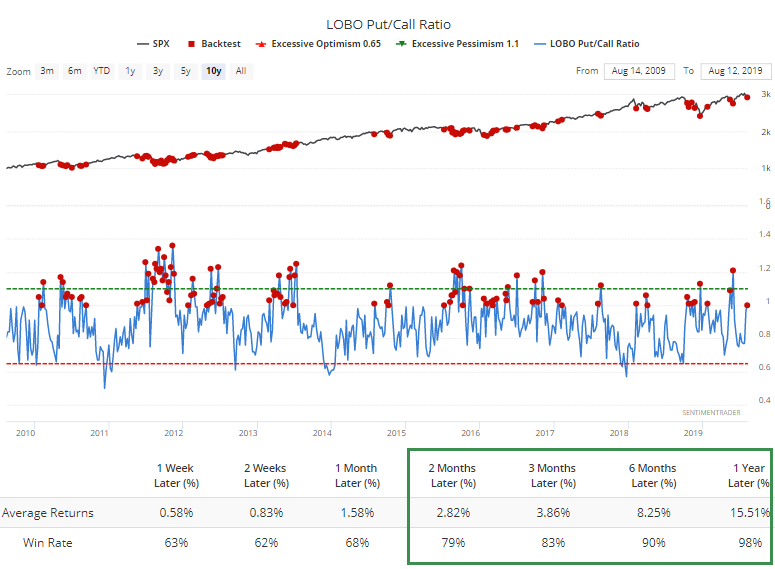
This is only a modest positive. It would have been a much better sign if small traders also showed more nervousness last week and pulled back on buying calls. That didn't happen, so I'm not weighing this too heavily.
Too Many Corrections
One of the concerns we've looked at during various points this year is the percentage of stocks within the S&P 500 that remain mired in corrections, simply defined as being 10% below their peaks.
During healthy market environments, this has averaged less than 40% of all stocks. During unhealthy markets - when rallies tend to be sold - this hangs above 40%. It dropped below 40% in June/July but spiked again early last week. It would really help to see this drop.
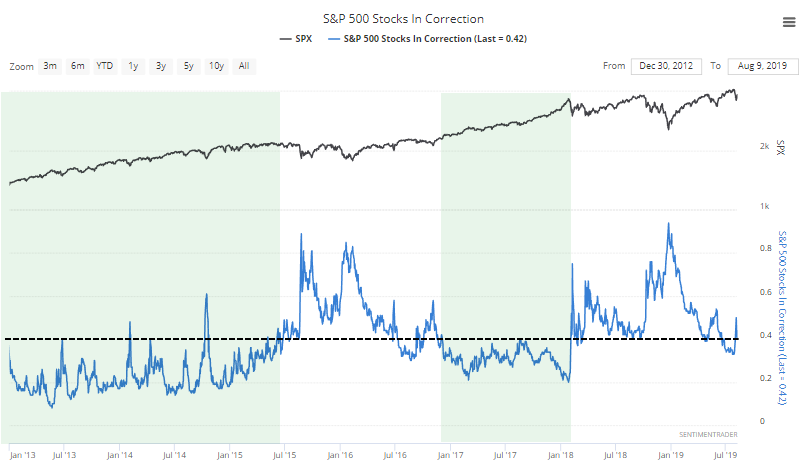
Same goes for the percentage of stocks stuck in bear markets. That usually stays below 20% during healthy markets, but has stubbornly remained above that threshold.
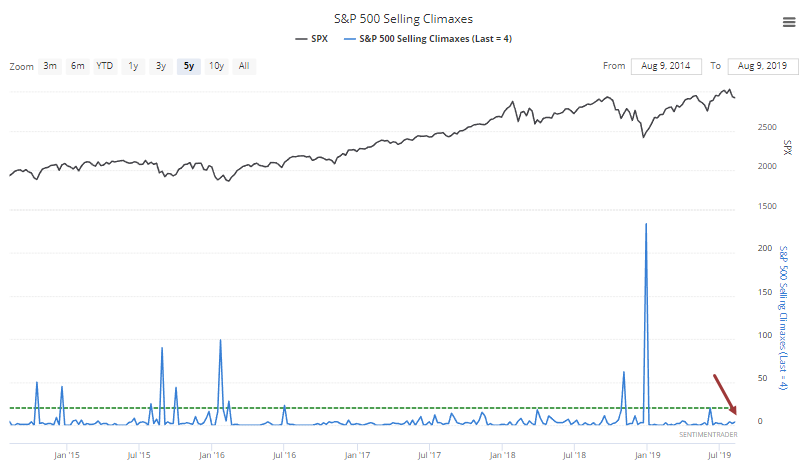
With so many stocks in negative trends, a sign of relief for bulls would be to see a spike in the number of selling climaxes. This happens when a stock drops to a 52-week low, then reverses enough to close in positive territory for the week. Despite the mid- to late-week recovery last week, there were few stocks that triggered one. Another worry.
Gold Bets
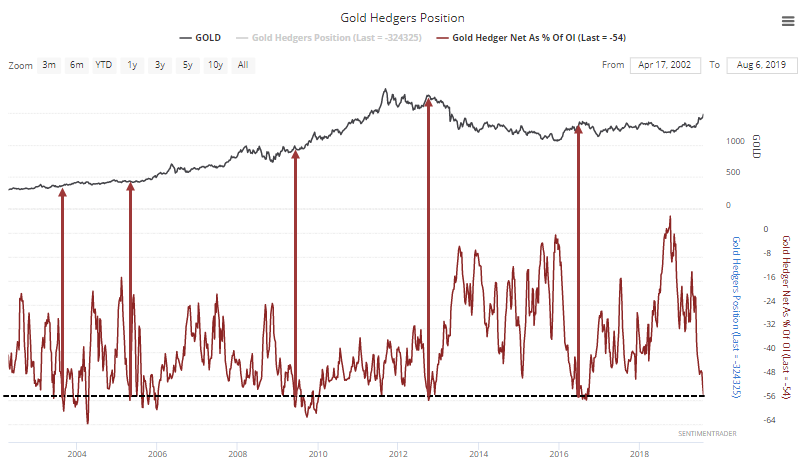
With what seems like a spike in geopolitical turmoil, traders have kept piling into gold. Speculators are heavily invested by this point, which means that hedgers, which take the opposite side of those trades, are heavily short. They now hold more than 50% of open interest in gold futures net short, the most since 2016.
Historically, when they first moved to this degree of short exposure, it coincided with peaks in the metal...but only since gold's long bull market ended in 2011. Prior to then, it preceded accelerations in the uptrend.
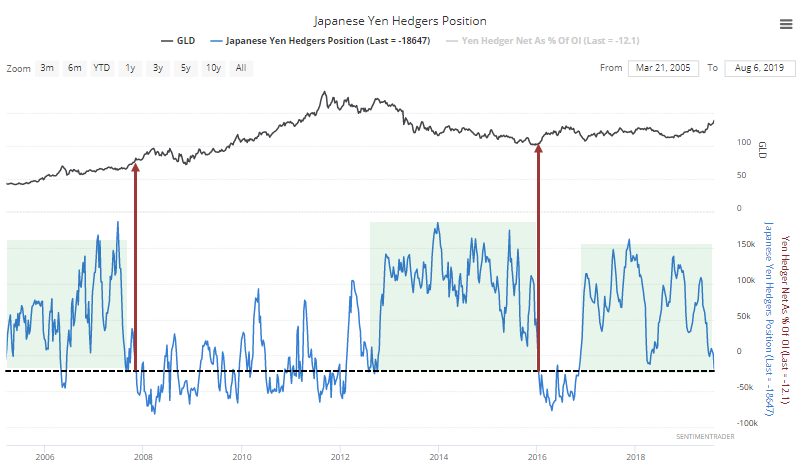
Hedgers have also started to more heavily short the Japanese yen. That has a close "haven" aspect with gold. The last two times hedgers definitively moved to aggressively short the yen after a long period without doing so, it preceded big upside moves in gold.
Both of these hint that "this time is different" with gold, something we've kept an eye on for months. The case has been building since early summer, since the metal hasn't behaved like it did for most of the past 8 years.
Penny-wise...
Hedgers moved to one of their largest-ever long exposures in the British pound, though it's still well below record levels in terms of open interest. That makes up part of the Optimism Index for the pound, which has fallen to a near-record low dating back to 1991.
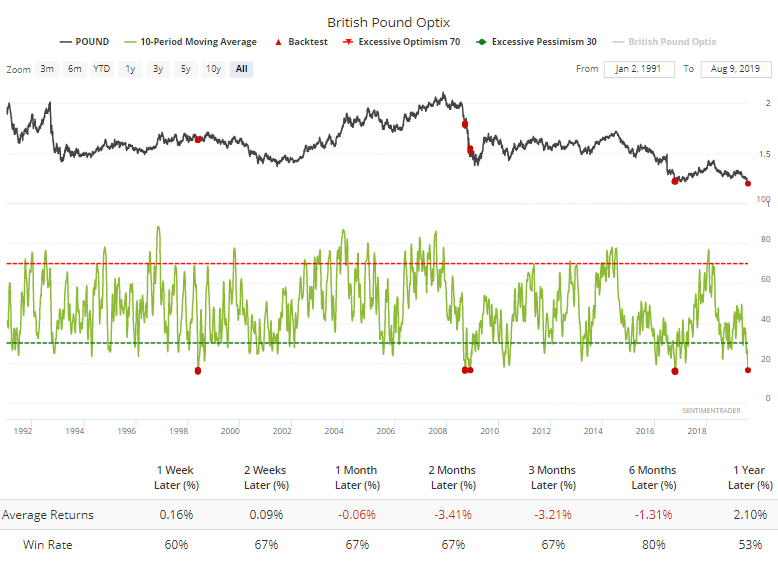
Returns were mixed, mostly due to 2008 when it gave a headfake.
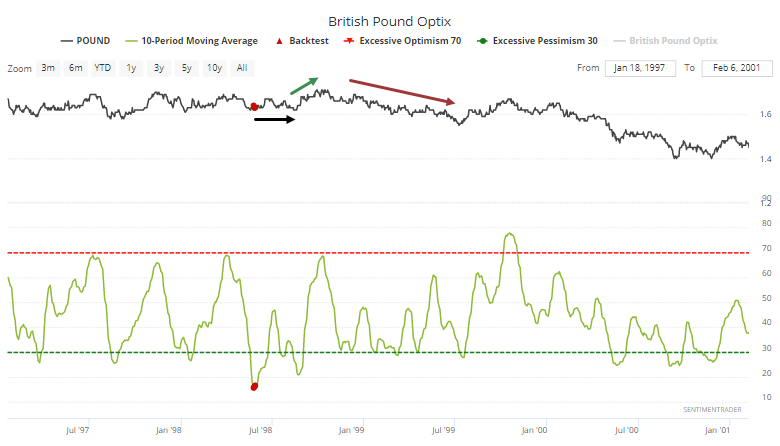
When it triggered in 1998, the pound chopped for a couple of months, rallied for a while, then fell out of bed again.
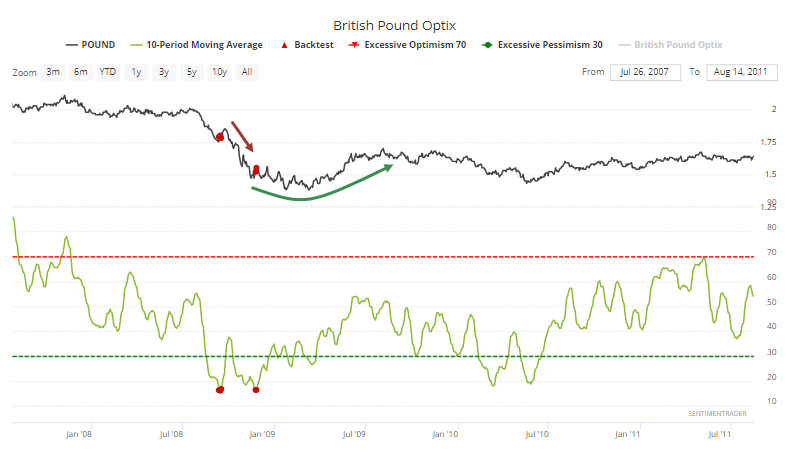
The first signal in 2008 led to only a very brief relief rally, then a plunge along with many assets during the height of the crisis. That led to a 2nd signal which preceded high volatility and a rounded base.
The only other time that optimism got this low was in 2016, which also resulted in choppy conditions over the next several months, ultimately leading to a sustained rally.
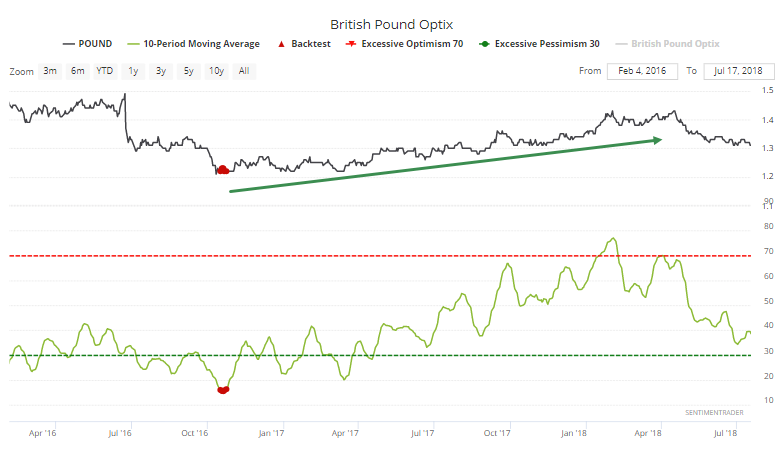
This is not a strong argument for an imminent rally. It does at least suggest we should be looking for potential bottoming patterns, though, with a high likelihood that further selling pressure will be temporary.
Sector Breadth
There weren't really any new extremes of note among breadth in the sectors and indexes we follow. Mostly there were smallish attempts at recovering from what has been a steady stream of selling, especially in Asian and emerging markets.
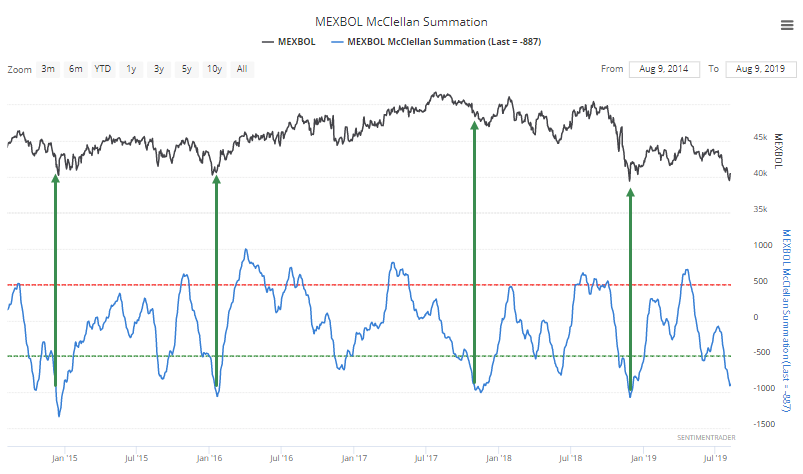
For Mexican stocks, the McClellan Summation has dropped below -900, a level that has indicated exhaustive selling pressure over the past 5 years.
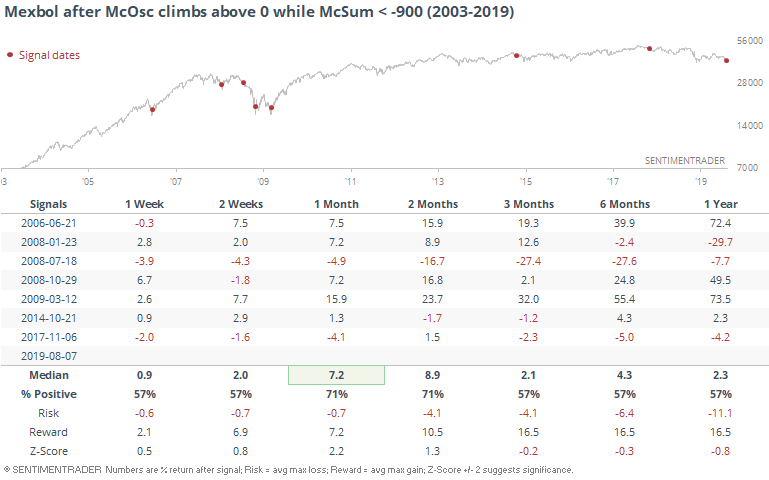
But for the first time in weeks, the McClellan Oscillator has climbed above 0, showing that buyers are at least making an attempt at reversing that downside momentum.
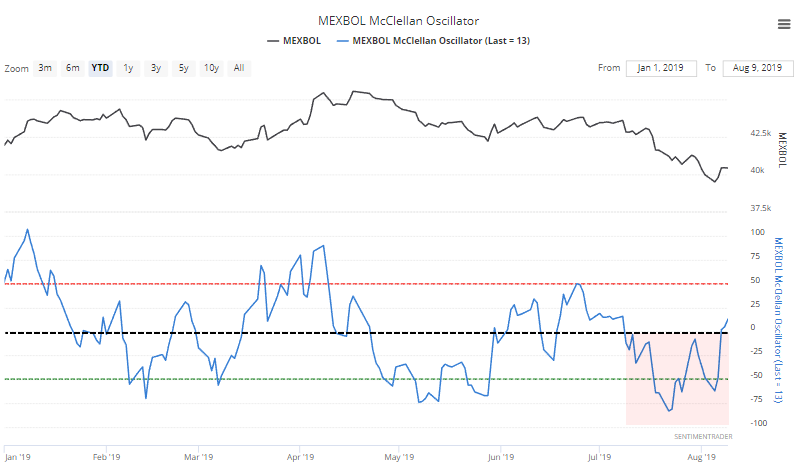
This has been a mostly good sign for Mexican stocks. There was a nasty failure (or two) in 2008, but otherwise pretty good.
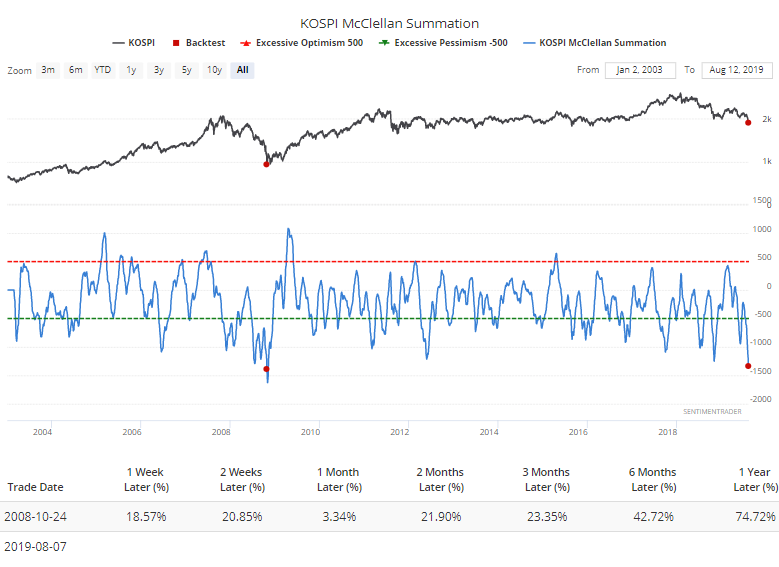
South Korea's Kospi is also trying to recover, with its Oscillator poking above 0 for one of the few times since July.
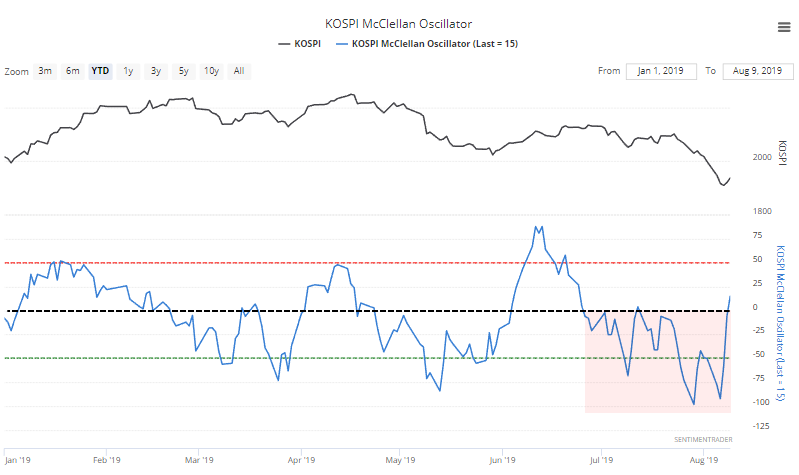
What's remarkable about that market, though, is that breadth has been so negatively sustained that the Summation index dropped below -1300 for only the 2nd time in 16 years.