Monday Color - High Gap, Weekly Indicators, Sector Breadth

Here's what's piquing my interest as buyers try to push stocks to new highs to start the month.
Back To Highs
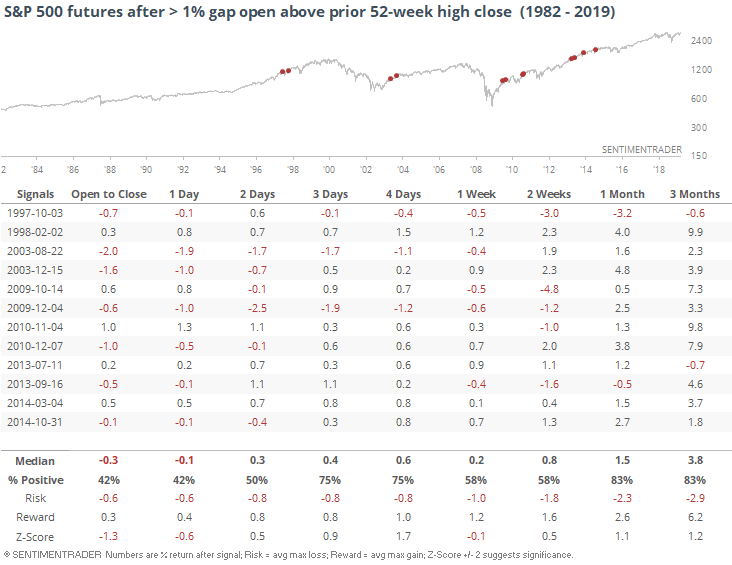
With a (temporary? permanent?) relief to trade tensions, buyers are pushing stock futures to new highs. For S&P 500 futures, this is the largest positive opening gap that is above all prior closes since October 2014.
In the history of the futures, it has triggered 13 times, enough for a baker's dozen. In the ultra short-term, buying into the frenzy was a bad idea more times than not, by a slight margin.
Out of all the signals, arguably only one was a true breakaway gap, in February 1998. There was essentially no risk from the open through the next few months.
If we filter out that single date, the stats turn more negative.
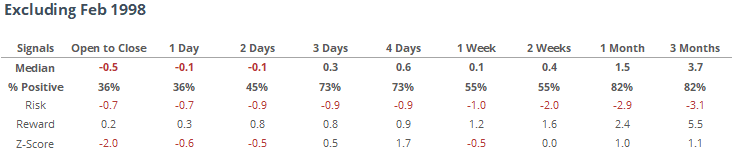
Buying the open and holding for a month led to risk of -2.9% versus reward of +2.4%, so not exactly a great setup for chasing, depending on one's idea of a good setup. Over the next 1-3 months, there were only two losses, and both were small. So upside was consistent, if somewhat limited and choppy.
If we relax the parameters to get a larger sample size, then it was the same basic conclusion.
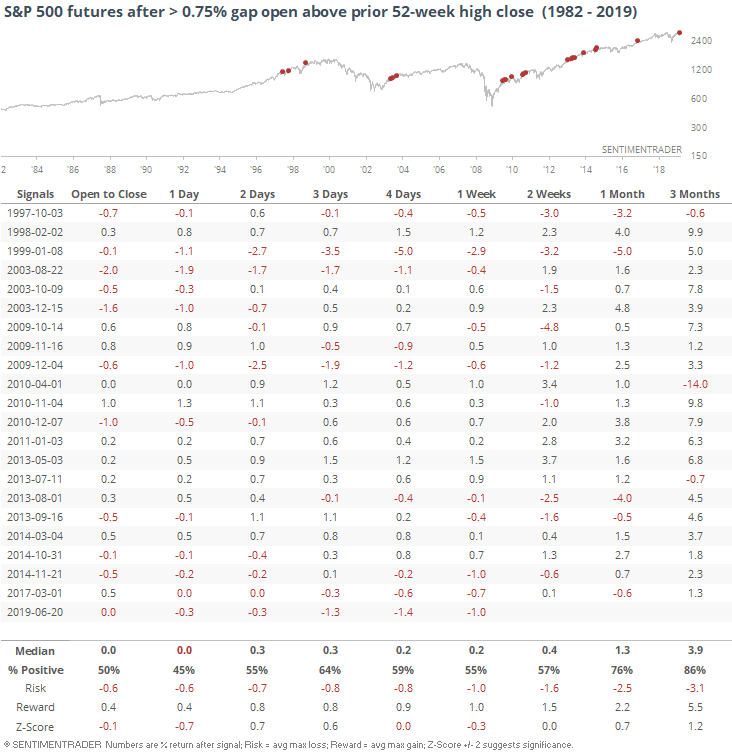
Again, across most time frames up to a month later, risk was equal to larger even larger than reward, even if most of the signals led to a higher price.
Almost all of these breakaway attempts triggered in the spring or fall. There were only 4 times when buyers attempted it during the lull of the summer months. For what it's worth, here are those returns.
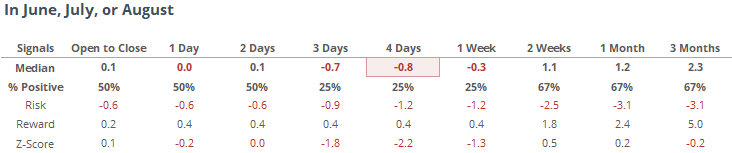
None of them managed to hold the gains, with each falling back at some point in the month(s) ahead.
Buying Exhaustion
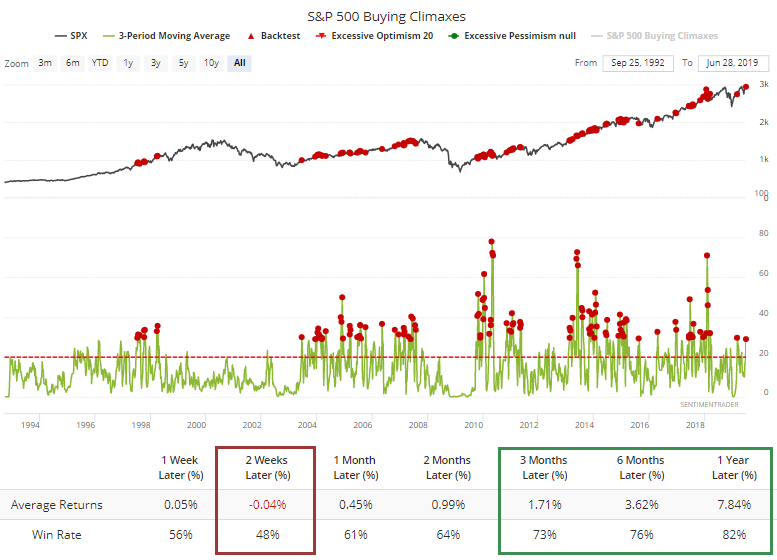
Indicators that we update weekly didn't show much of a change last week, though there was an uptick in the number of buying climaxes among S&P 500 stocks. More than 30 tickers saw a trade at a 52-week high then fell back to close below the prior week's close.
Over the past 3 weeks, there has been an average of nearly 30 stocks suffering this fate. That's high, borderline extreme, and has preceded mostly weak returns over the next couple of weeks, but not beyond that.
An encouraging sign is that finally, fewer companies are mired in correction territory. Fewer than 40% of S&P 500 stocks are more than 10% off their highs, a threshold which has served to be a decent determinant of trend.
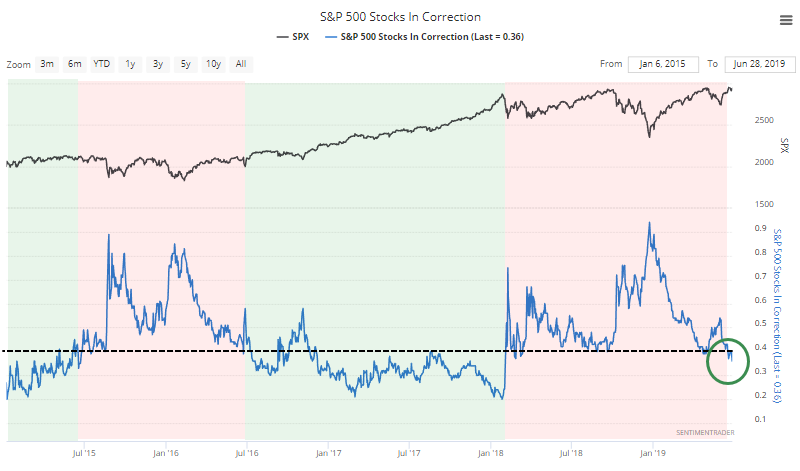
We can see above that when fewer than 40% of stocks were in corrections, the S&P 500 had an easier path to rise; when more than 40% were, the index was rangebound at best. It's early days, but this is a good longer-term sign.
Breadth Review
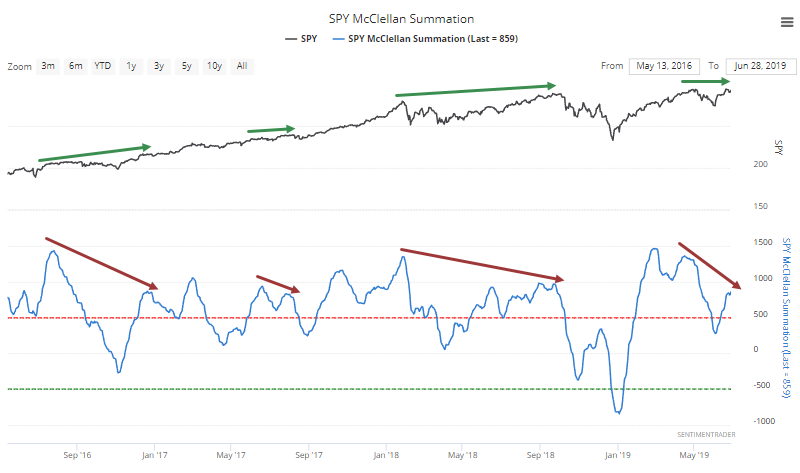
Longer-term underlying momentum has turned positive for most sectors and overseas markets, though most are also well below their previous highs even as the indexes hit higher highs, setting up potential divergences. Divergences have a mixed track record, though.
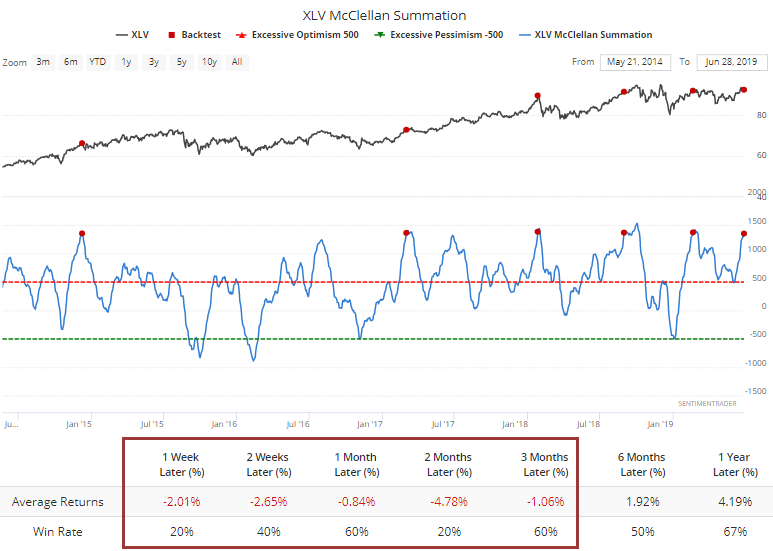
One area where there is clearly no divergence is health care. That Summation Index just crossed above +1,350, an extremely high reading. The XLV fund has had trouble holding such sustained upside momentum in its stocks other times the indicator crossed above this threshold.
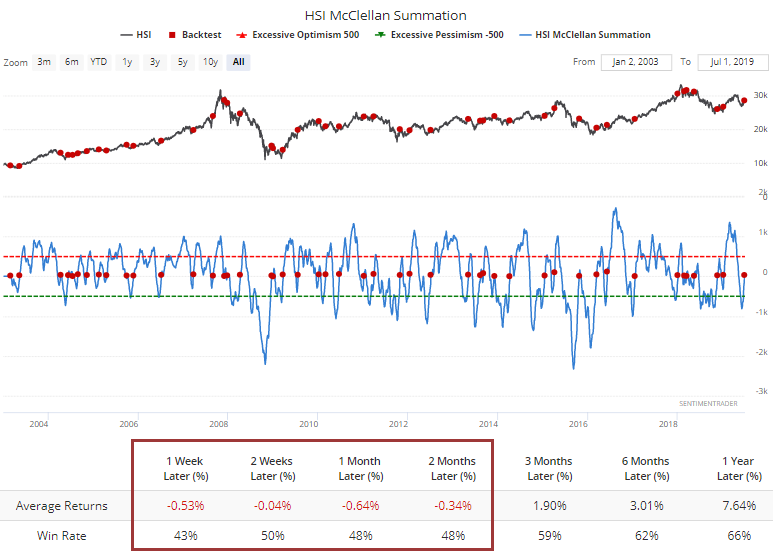
For the Hang Seng, the McClellan Summation Index has just crossed back above the zero line. That has led to only limited upside shorter-term when it's happened before.