
Monday Midday Color

Here's what's piquing my interest so far today.
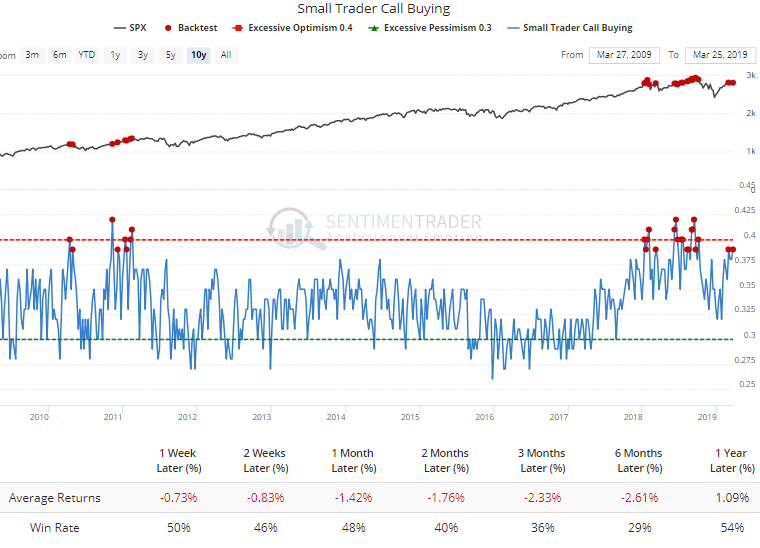
Confident Traders
The weekly summary of options trading across all U.S. exchanges shows that the smallest of traders are still buying calls to open at a pretty aggressive clip. They spent 39% of their total volume on purchasing speculative call options.
Since the financial crisis, this ranks among the highest levels, and we can see that stocks struggled to hold gains the other times it got this high. Their put buying is still relatively elevated, though, so that's some relief.
Questionable Quality
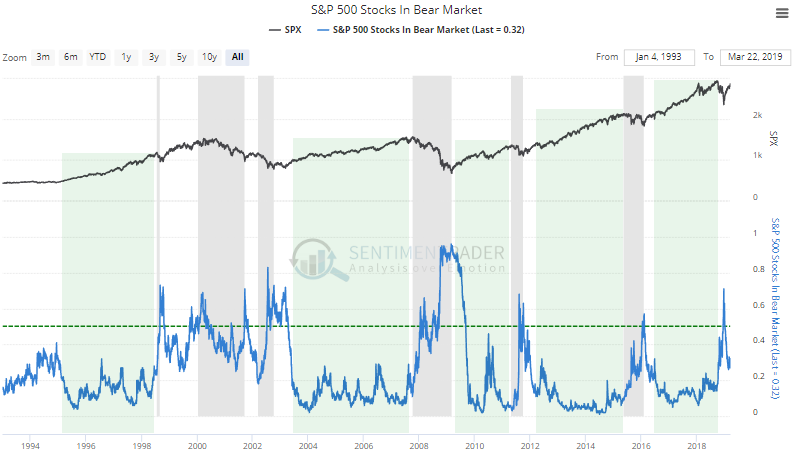
The jarring move to end last week helped to deteriorate some of the internals. A third of S&P 500 stocks remain mired in bear markets. This hasn't improved at all in the past month. Healthy markets typically see fewer than 20% of stocks in bear markets.
A technical rule of thumb that is mostly true is that healthy markets also tend to see more than 60% of stocks holding above their 200-day moving averages. Unhealthy ones tend to see fewer than 60% of them doing so. We're hanging right around that level now and haven't been able to sustain a move above.
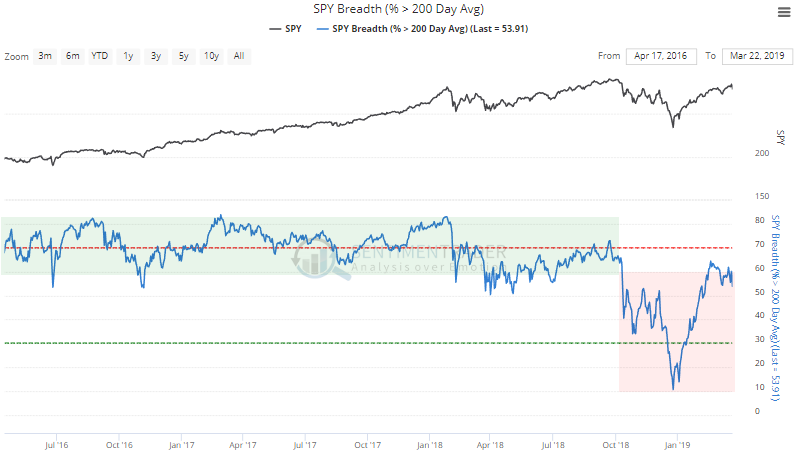
It's not a good buy/sell trigger, it's more of an environmental clue, and currently it's arguing caution.
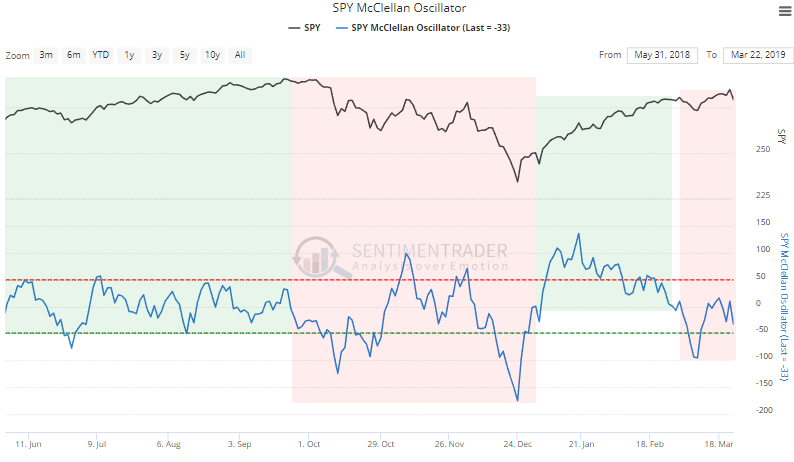
Healthy markets also see the McClellan Oscillator generally holding above the zero line, with oversold conditions triggering upside reversals when it drops to -50 or so. Unhealthy markets see the Oscillator mostly hanging below zero, with overbought readings above +50 typically leading to quick reversals. We're still holding below zero now.
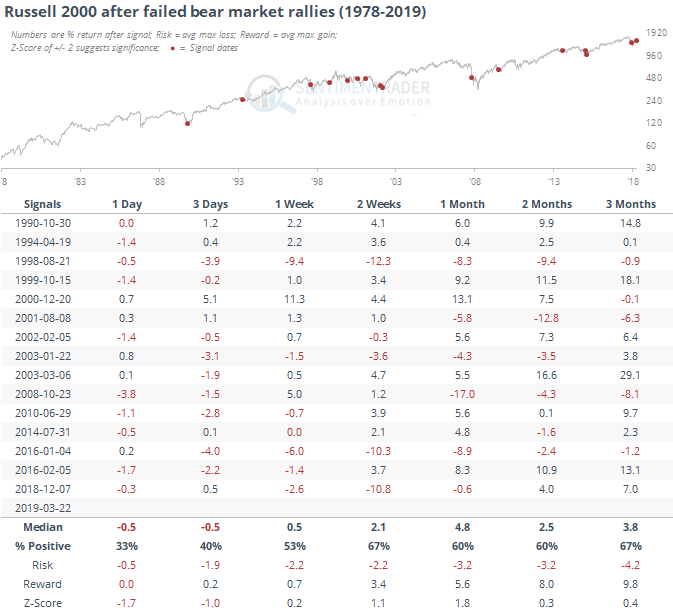
Failed Rally
Also concerning is the lower low in the small-cap Russell 2000. After a mediocre rally attempt, it fall apart on Friday, carving out a lower high and lower low.
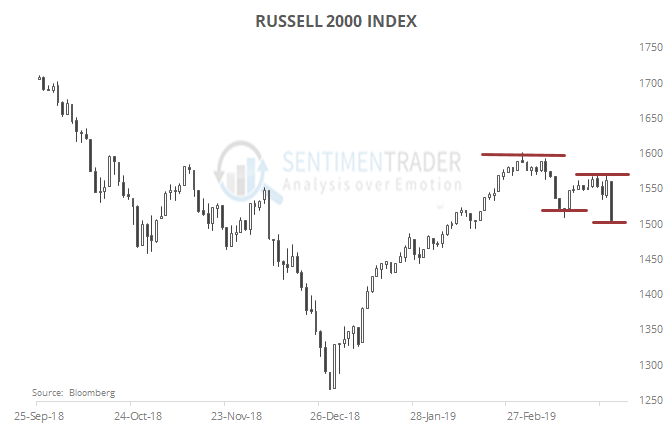
Failed bear market rallies have typically led to some further short-term selling pressure but were inconsistent after that, though.
Inverted
We're probably all tired of hearing about the yield curve by now. So let's just leave it at this - when the accepted definition of the curve is inverted, returns in the S&P 500 is poor.
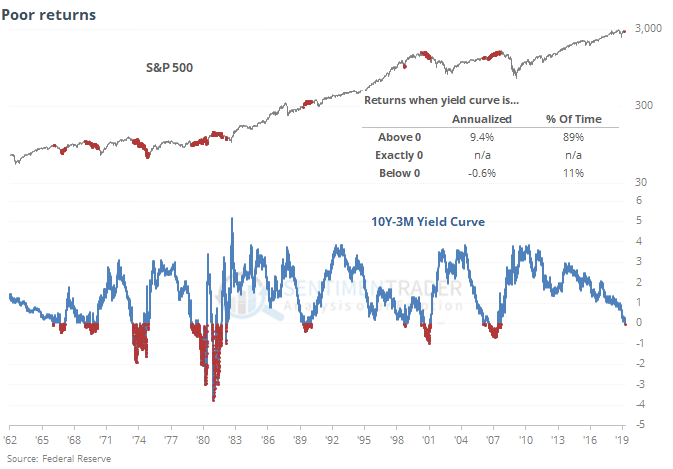
Ignoring all other factors, when the curve is inverted, the S&P 500's annualized return is -0.6%, which occurred on 11% of all days since 1962 (thanks mostly to the 1970s). When it's not inverted, the S&P's return is an annualized +9.4%.
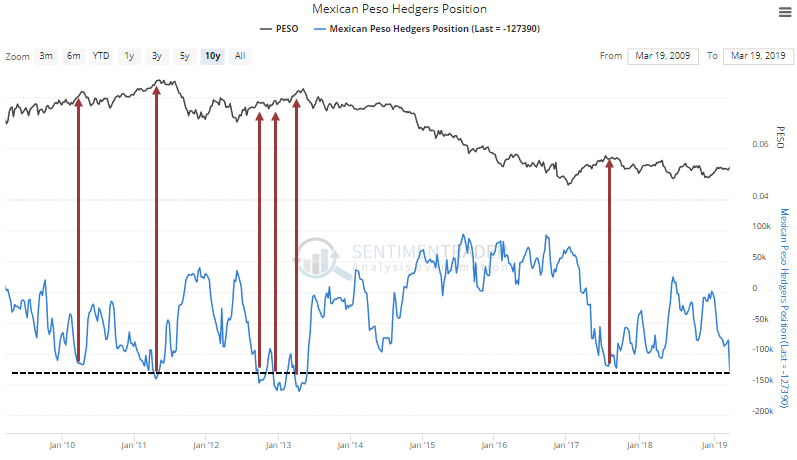
Selling Mexico
The latest Commitments of Traders report showed only one new extreme of note as "smart money" hedgers aggressively sold the Mexican peso. They're now holding more than 50% of the open interest net short, among their largest bets against the currency in four years. It's large on both a relative and absolute scale.
Options traders have been going along with speculators, and the risk reversal on the peso is showing extreme optimism.
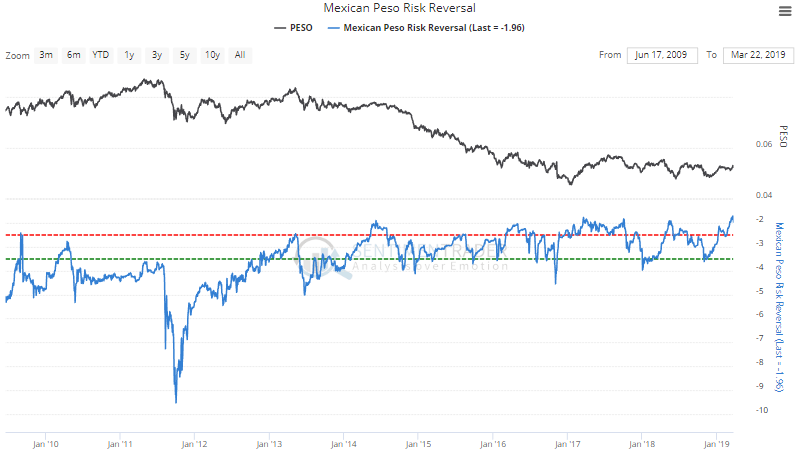
It's an imperfect gauge, but is a hint that risk in the peso is high and if it continues to power higher in the weeks ahead, suggests a high potential for long-term trend change after a long bout of poor performance.