Monster momentum versus poor participation
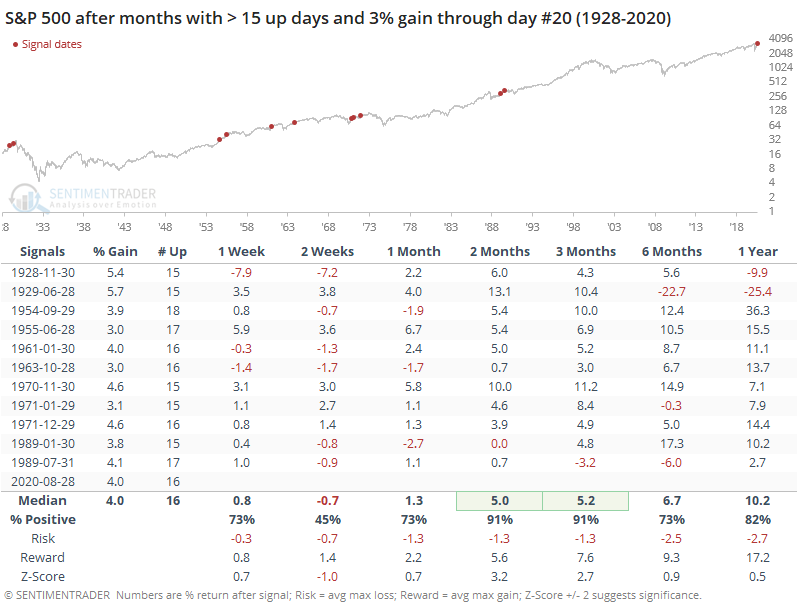
We spend a lot of time looking at momentum because it's the #1 factor that can put sentiment extremes on hold, or run over them entirely.
Entering the month, conditions were ripe for risk, and it did not pan out, to put it mildly. Far from seeing any weakness, this is going down as one of the most consistent months in history.

While the others saw a bit of softness during the start of a new month, by 2-3 months later there was only a single (small) loss.
Most of these triggered during more seasonally positive times of the year, with those 2-3 month windows occurring during the winter months. No other August even comes close. If we relax the parameters (a lot), then we can get a larger sample for August specifically.
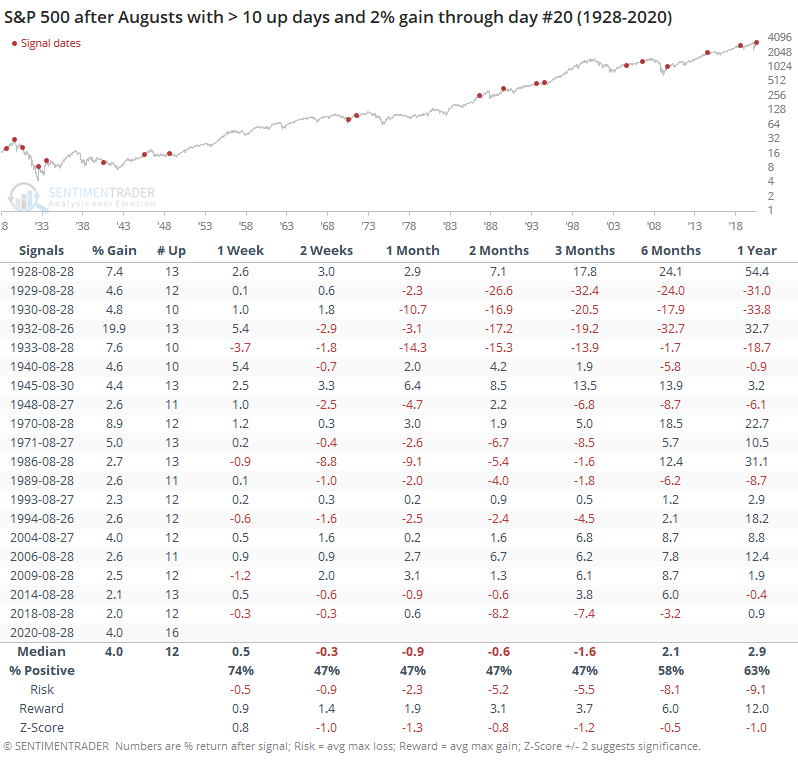
Those signals showed decidedly less robust returns. September and October have a reputation for volatility, and a really positive August didn't necessarily cancel that out.
Longer-term momentum is impressive, too
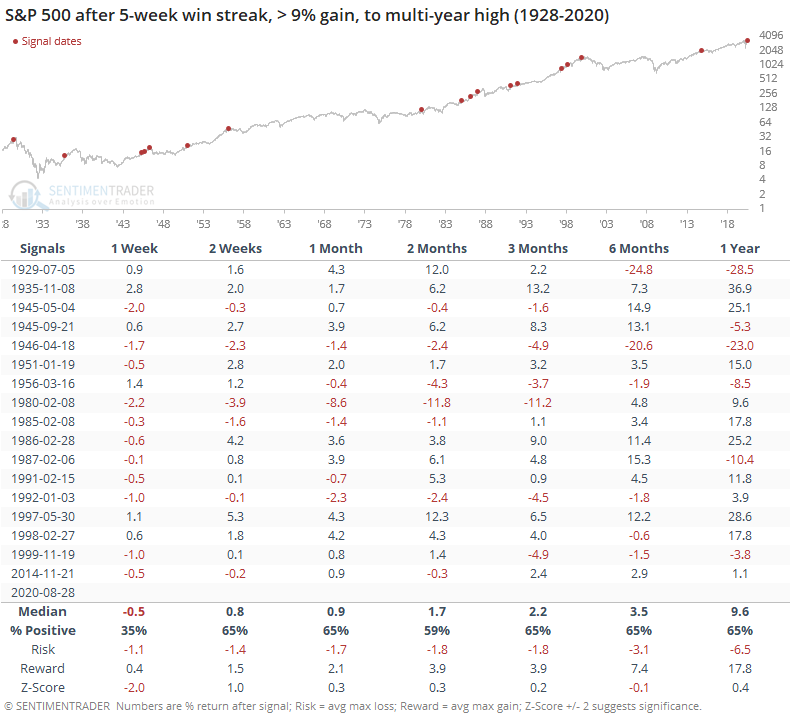
This kind of consistent string of up days has allowed the S&P to rally for 5 straight weeks. It's been a heck of a run, too, setting new highs and tacking on more than 9%. Other times it managed to run like this, it typically pulled back over the next week, then showed returns that were about in line with random. The last two, in 1999 and 2014, showed exhaustion.
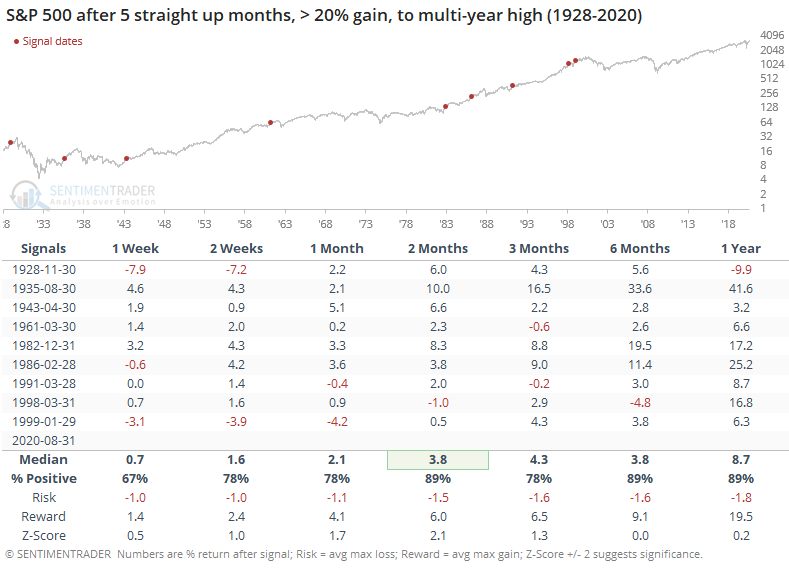
On a longer time frame, this will also mark the 5th straight month with gains. There is no precedent in terms of the magnitude of the rally we've seen, but when looking at smaller 5-month rallies to new highs, returns were good.
It hasn't just been the past 5 months that have seen gains, though. Memories are short, and many seem to forget that January and much of February also saw a consistent deluge of small positive daily gains. So far in 2020, more than 59% of the sessions have been positive, tied for the 7th-best year in history.
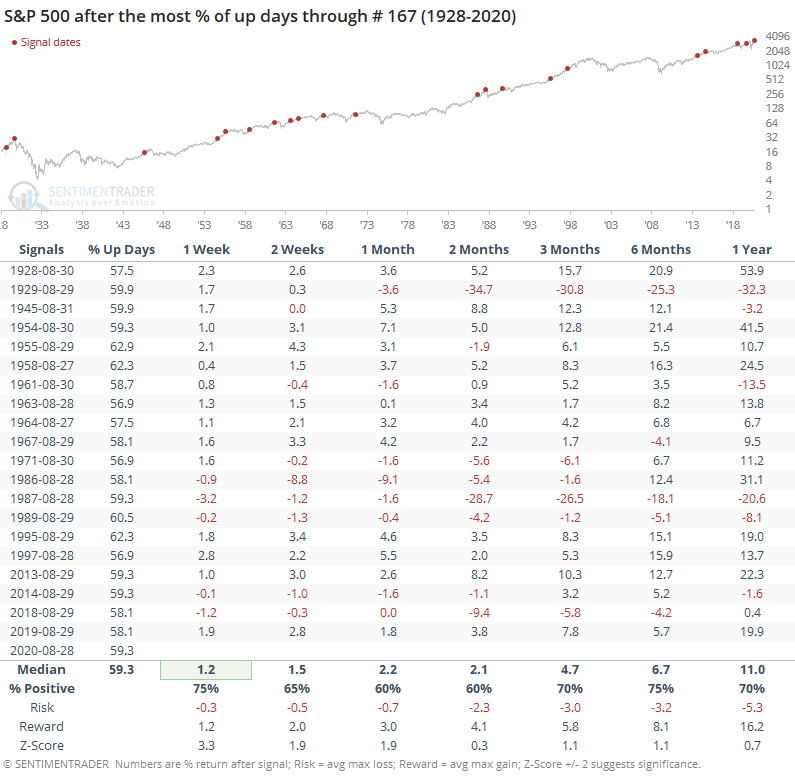
After other consistently positive years through the end of August, forward returns were decent. There were a handful of big failures over the ensuing weeks-to-months, but overall the bias was to the upside.
Contrast that to the 20 years with the least amount of positive sessions through August. There was a definite downside bias into September and October during bad years.
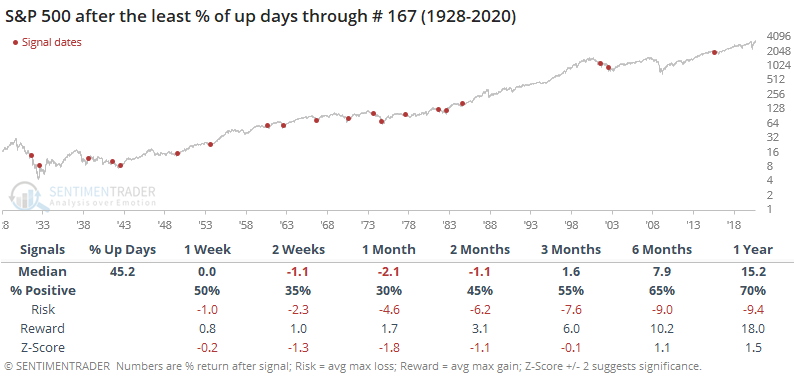
Overall, the price momentum looks to be a positive for forward returns. The biggest caveat is seasonality, as this is one of the very few times we've ever seen this kind of run during the summer, and before what is usually a volatile fall season.
Big gains, but questionable participation
What's also curious about our current streak is the relatively poor participation. We've noted for weeks - with absolutely no impact so far - that the market environment is still neutral at best. That's due in part to the percentage of stocks, industries, sectors, and countries that have been holding above their 200-day averages.
They're still somewhat weak. Healthy markets see these figures hold well above the 60% threshold, and most of them are floundering right about there.
Within the S&P 500, the last week of records all occurred with fewer than 65% of its member stocks above their 200-day averages and with fewer than 10% of stocks also hitting new highs. There has never been a cluster like this in the past 30 years.
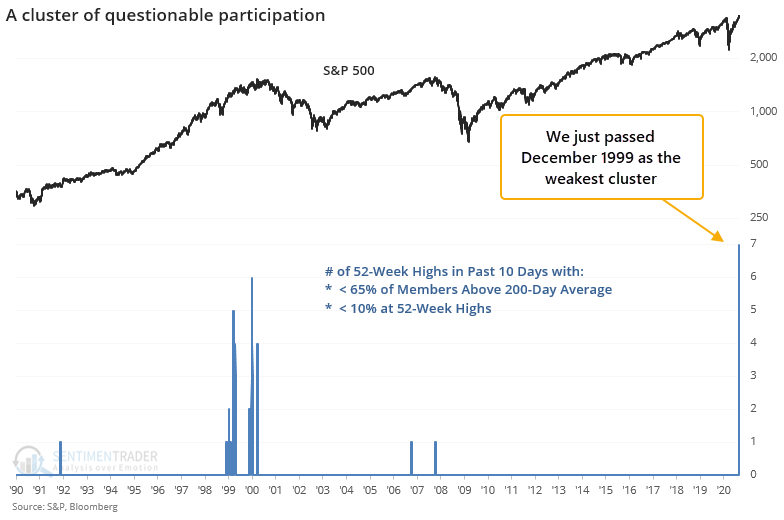
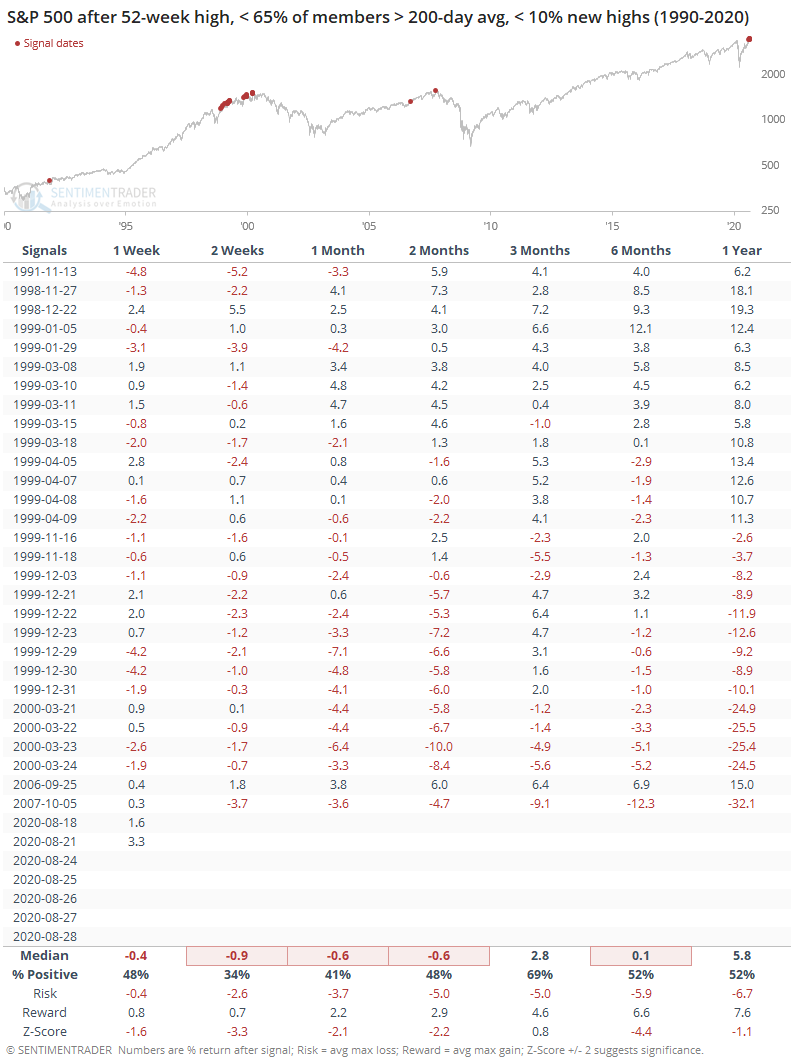
We just passed December 1999 with the most days in a 10-day window showing a lot of new highs in the S&P 500 index itself but with relatively few members in uptrends and setting new highs. The table below shows all of the individual days that met these criteria.
The reason for these oddities is no secret, as the big tech stocks continue to power the major indexes higher. This has been the case for a couple of months, and there has been no letup. As noted by Bloomberg and others, this kind of behavior has pushed the correlation between the S&P 500 capitalization-weighted index and its equal-weighted version to a near-record low.
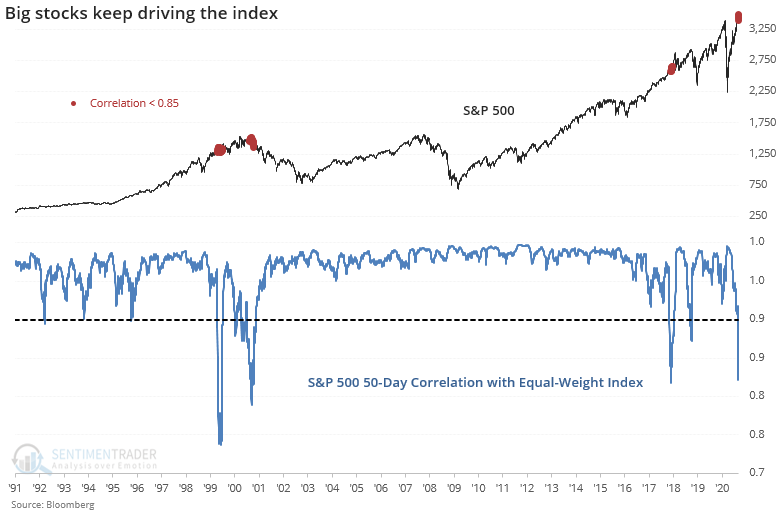
Other times the 50-day correlation dropped below 0.90, stocks wobbled.
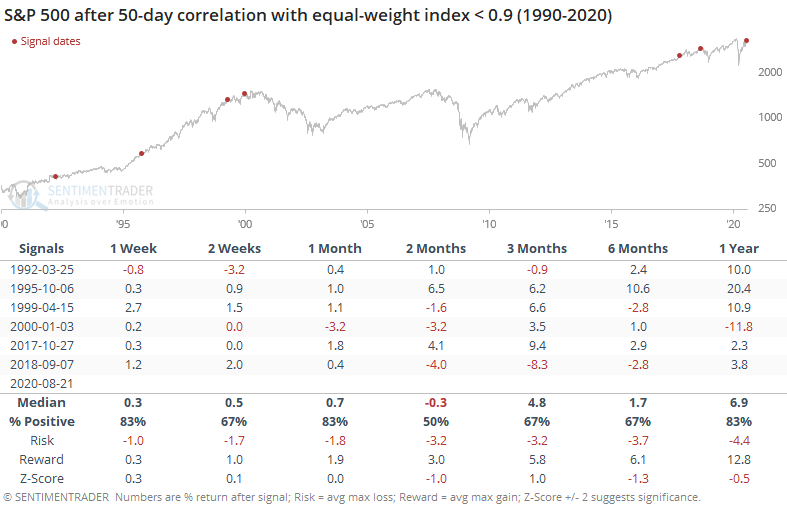
This didn't have any impact in 1995, and in 2017, stocks managed to tack on impressive gains in the months ahead before faltering. But the others were at least modest warning signs that the top-heavy market was unsettled.
So far, this market has been able to roll over any and all negatives. That's due in very large part to a handful of very large stocks. It's already gone quite a bit further, and longer, than most historical comparisons would have suggested, so maybe this time is truly different and the environment is unlike anything we've ever seen before. That kind of belief is usually a siren song, luring investors toward the rocks when they tire of hearing the catcalls from over-confident trend-followers.
They've been right, and that's awesome. We just find little evidence that momentum in the headline indexes is enough to continue to counter explosions in optimism and weak internals.

