
Monthly Anomalies You Are Probably Not Aware of (Part II)

This is Part II of a three-part series looking at unique seasonal anomalies in the stock market that most traders are not aware of.
In Part I, I looked at something of an odd "quirk" in the stock market calendar. In this piece we will move onto something a bit "meatier". The goal is to uncover unique ways for traders and investors to find an "edge" in the markets. And what we find when we look carefully is that often some of the most useful information "hides in plain sight."
Identifying "Trading Days"
As we did in Part I, we start by counting back trading days from the end of the calendar month. As such:
- The last trading day of the month is designated as "TDM -1"
- The 2nd to last trading day of the month is designated as "TDM -2"
- And so on and so forth back to TDM -10
The Period Under Consideration
For Part II the period will look at is:
- The 6-day period each month that includes TDM -10 through TDM -5
- We will look at 90 years of history from 12/31/1930 through 12/31/2020
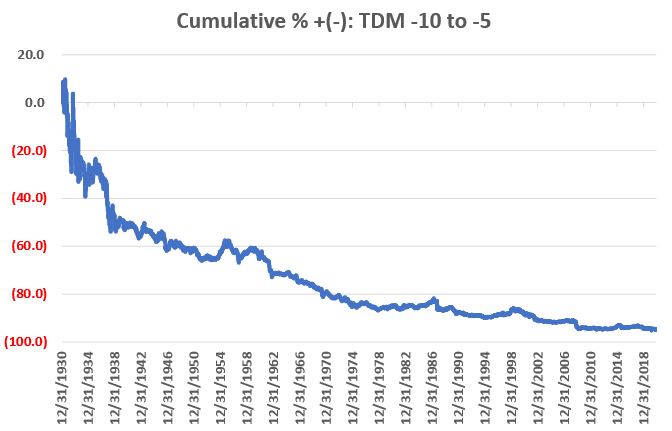
The figure below shows the cumulative % price gain for the S&P 500 Index held only during this 6-trading day period each month over the full 90-year test period (i.e., the cumulative price return if one had bought the S&P 500 Index at the close of TDM -11 and sold it six trading days later at the close on the 5th to last trading day of the month, and repeated this process every single month).
It is NOT a pretty picture.
For the record, had an investor been stubborn (foolish?) enough to buy-and-hold the S&P 500 Index ONLY during this 6-day period every month starting in January 1931, the cumulative loss through 12/31/2020 would be -94.9%. This during a 90-year period which saw the S&P 500 Index grow +24,386% (using price data only) on a buy-and-hold basis.
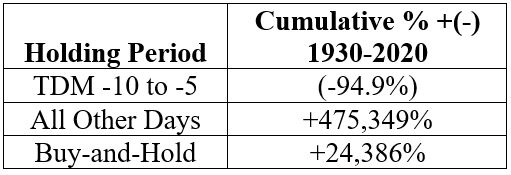
The table below displays the cumulative hypothetical price performance achieved by holding the S&P 500 Index:
- ONLY during trading days TDM -10 through TDM -5 each month
- During all trading days NOT including TDM -10 through TDM -5
- On a Buy-and-Hold Basis
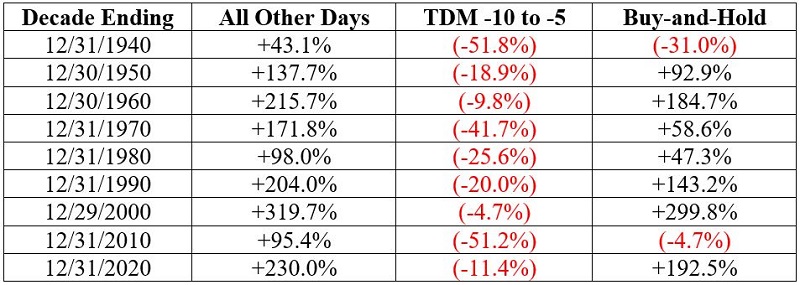
The table below displays the decade-by-decade price performance for holding the S&P 500 Index:
Considering Time of Year
As long as we are venturing out "into the weeds", let's go one step further and point out that there appears to be a, um, seasonal element to this seasonal element. In a nutshell, TDM -10 to -5 performance has been significantly weaker during the months of June through November than during the months of December through May.
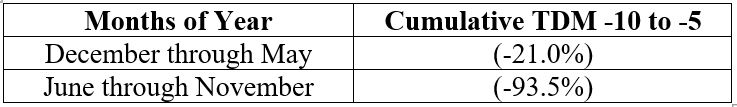
The chart below displays the cumulative % return achieved by holding the S&P 500 Index ONLY during TDM -10 through TDM -5 every month depending on the particular months involved.
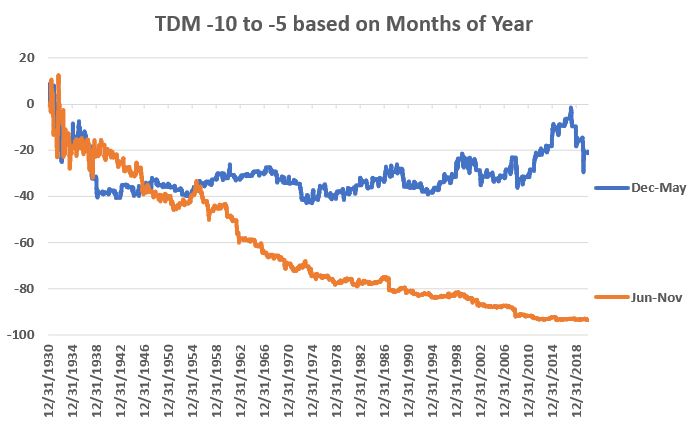
Results during December through May are poor, but are essentially "hit or miss." Results during June through November are mostly just "miss."
Stay tuned for some slightly more positive news in Part III.