
More Stocks Struggle Under the Surface

For months now, and especially since the peak in speculative mania in February, we've watched closely for internal deterioration in the major indexes.
Those signs popped up sporadically, with a day or two of oddly poor breadth readings in the S&P 500 or broader market. But usually, within a couple of days, things would completely reverse and wipe away any divergences.
Not so much this time.
Last week, we saw that the remarkable momentum run in the S&P has come with fewer than 60% of its stocks holding above their 50-day moving averages. That's one of the starkest divergences, over a respectable time frame (not just a single session), since 1928.
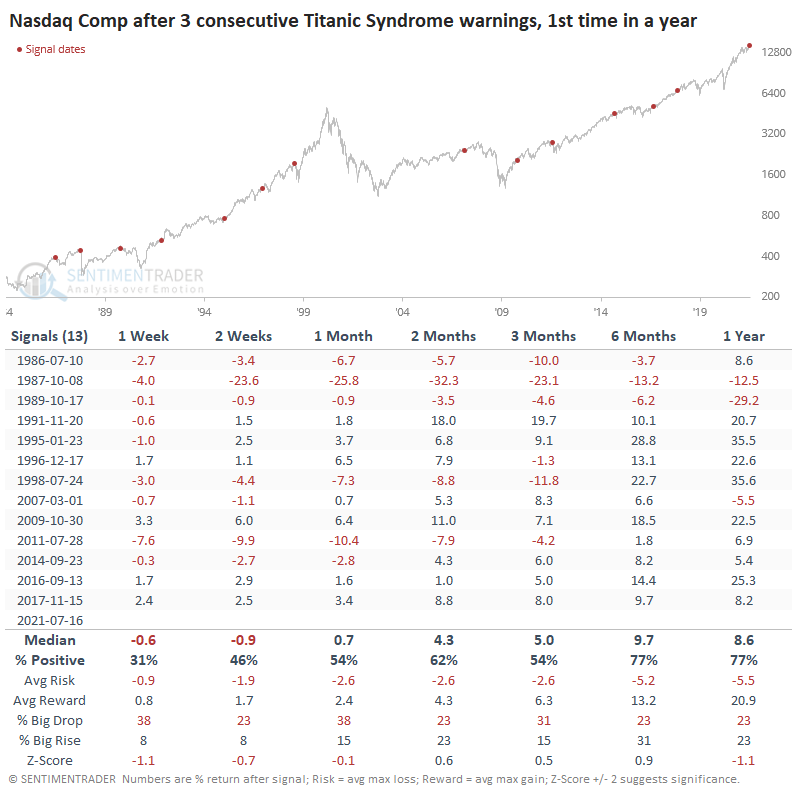
We've also noted that on the Nasdaq, we quickly switched from the Composite sitting at record highs to having more stocks at 52-week lows than 52-week highs. The past three sessions all triggered a Titanic Syndrome warning as a result.
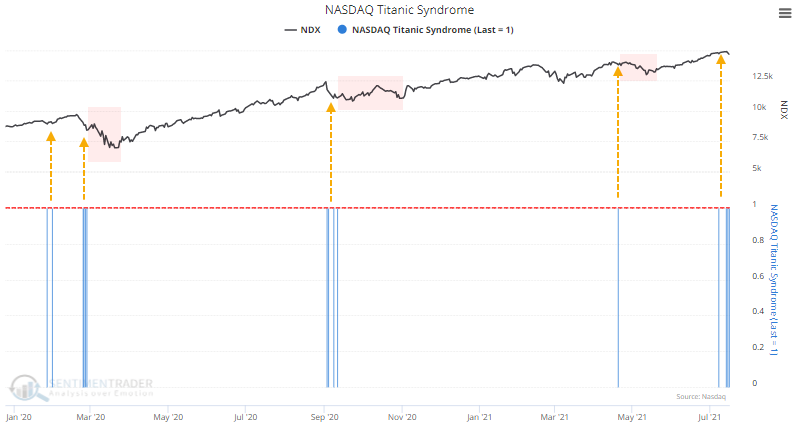
After other back-to-back-to-back warnings, the Nasdaq tended to continue sliding. Over the past few years, in particular, those warnings proved to be short-lived only.
FOLLOWING BREADTH LOWER
All of this internal weakness has bled into broader measures. The Cumulative Advance/Decline Line for the NYSE has now sunk to a multi-month low.
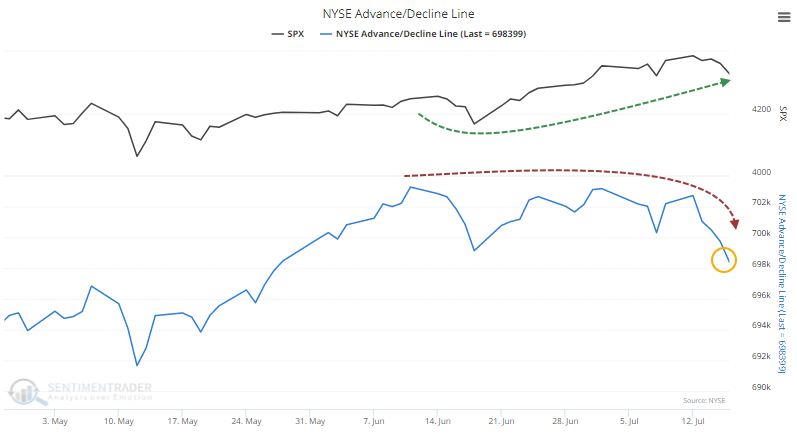
Since the A/D Line peaked on June 11, the S&P 500 has gone on to add more than 100 points and was perched at an all-time high within the past week. The A/D Line, in contrast, has sunk enough to be at its lowest point in two months.
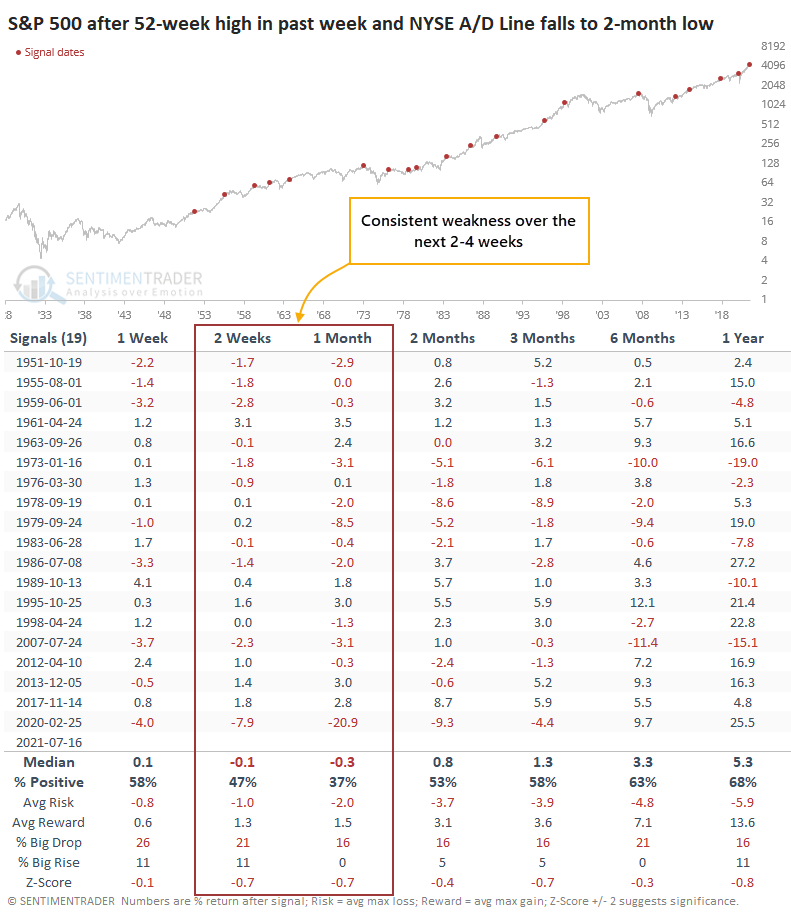
When this has triggered in the past, the S&P tended to follow the A/D Line lower, with a positive return over the next month only 37% of the time. It showed more risk than reward up to three months later and showed below-random returns across all time frames.
WEAKNESS ON BOTH NYSE AND NASDAQ
This same phenomenon is playing out on the Nasdaq. Over the past 40 years, there have only been three other times when this triggered on both the NYSE and Nasdaq within days of each other.
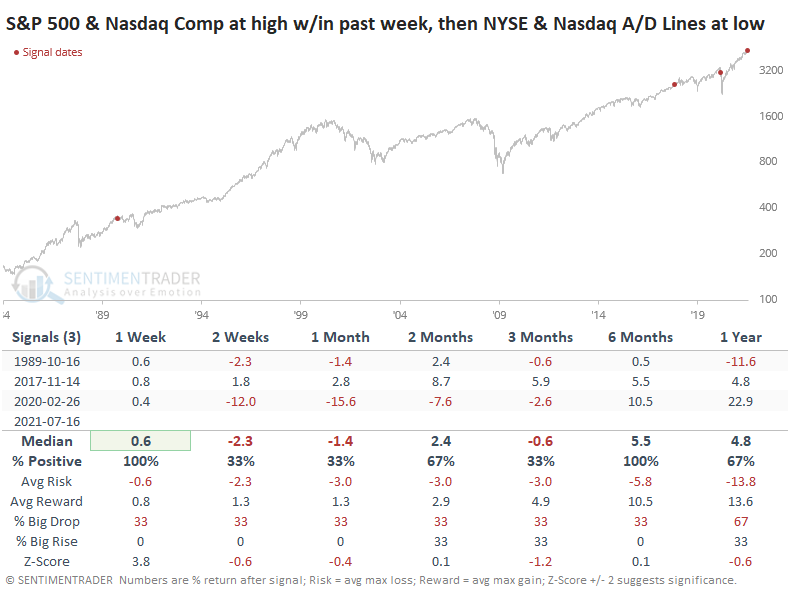
These three preceded the 1990 recession, the 2018 letdown from a speculative peak, and the global pandemic.
The Advance/Decline LIne is heavily influenced by small-cap stocks, interest-rate influenced issues, and other more esoteric securities on the NYSE. And for the past 20 years, we've said, "Good!" Those issues are sensitive to economic conditions and make the A/D Line a better indicator than the one that monitors common stocks only.
The divergences that are evident now aren't too major and haven't persisted for a very long time. That suggests they're less likely to be indicating a major, prolonged slump. The impressive price momentum in the S&P 500 through June is another longer-term positive. As we head into a seasonally rocky period, though, these divergences are enough to suggest that risk is high for short- to medium-term traders.