
More volatility
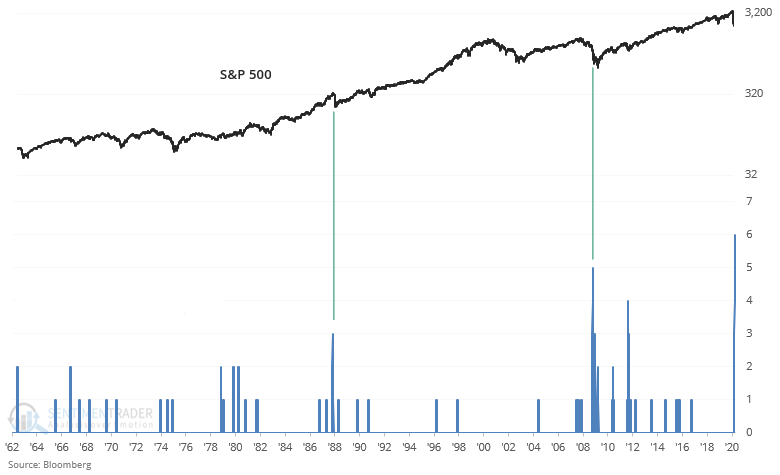
Sharp market crashes usually don't see a V-shaped recovery. These sharp selloffs are usually driven by a major reason (not just sentiment), and that reason doesn't usually disappear in a flash overnight. The selloff on Wednesday gave testament to that. 6 of the past 20 days have seen more than 90% of NYSE issues fall. This exceeded 1987 and 2008, both of which saw significant medium term rallies.
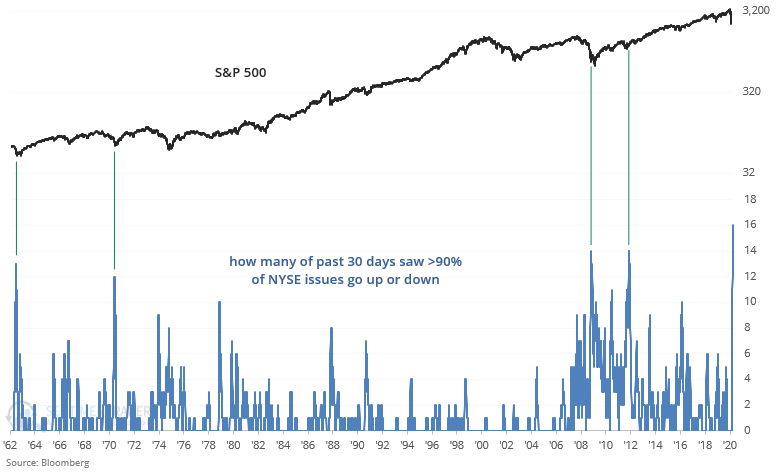
And since such strong selloffs are usually followed by countertrend rallies, many of the past 30 days have been all or nothing days (every stock going up or every stock going down). Once again, the following figure set a record. Less extreme historical cases at least marked medium term bottoms:
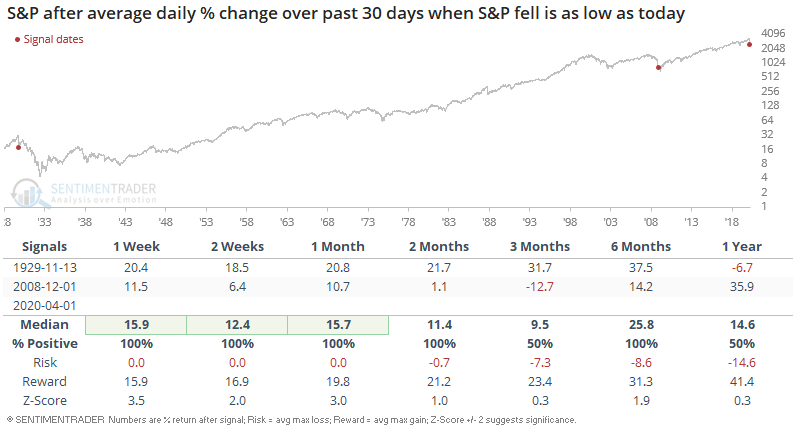
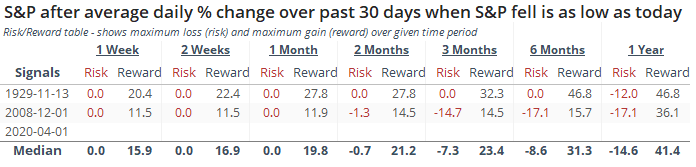
Just looking at daily % moves, this is extreme. The biggest down days happen during bear markets, and so do the biggest up days:
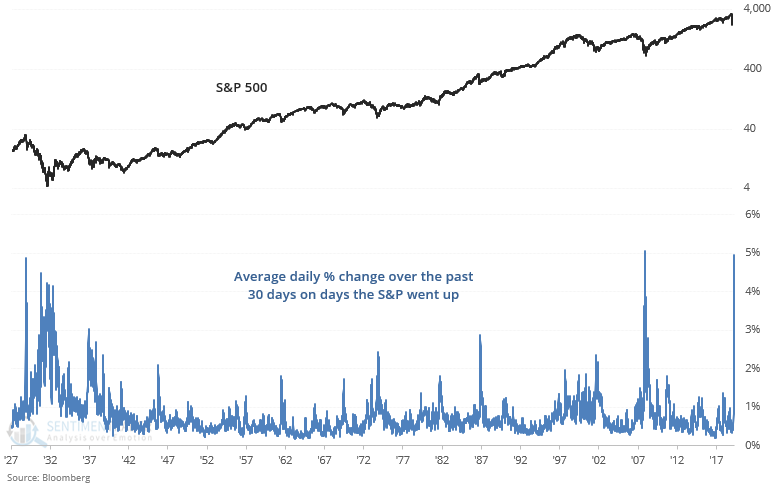
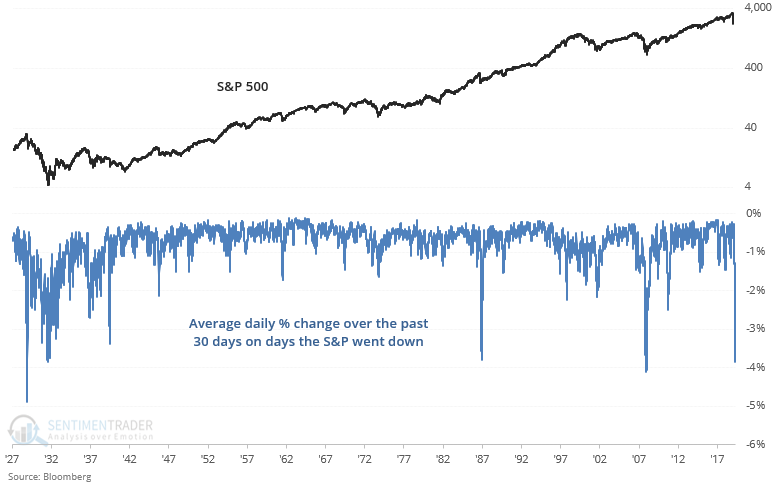
Sample sizes are low, but even in the most extreme of cases (1929-1932 and 2007-2009) this led to a short-medium term bounce:
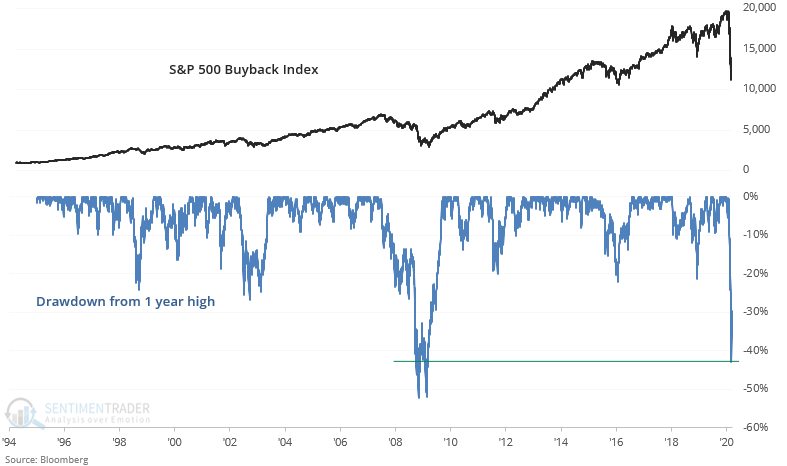
And lastly, the S&P 500 Buyback Index (100 stocks with the highest buyback ratios) has collapsed, falling more than the broader S&P 500. Companies that aggressively bought back their own stocks over the past few years are probably wishing they hadn't...
Overall, such extremes support a short-medium term bounce. After that, let's just take things 1 day at a time.