
Most stocks, industries, sectors, and world indexes are unhealthy

When it comes down to brass tacks, investing sounds simple. Buy stocks when investors are pessimistic during healthy market environments, and sell them when investors are optimistic during unhealthy ones.
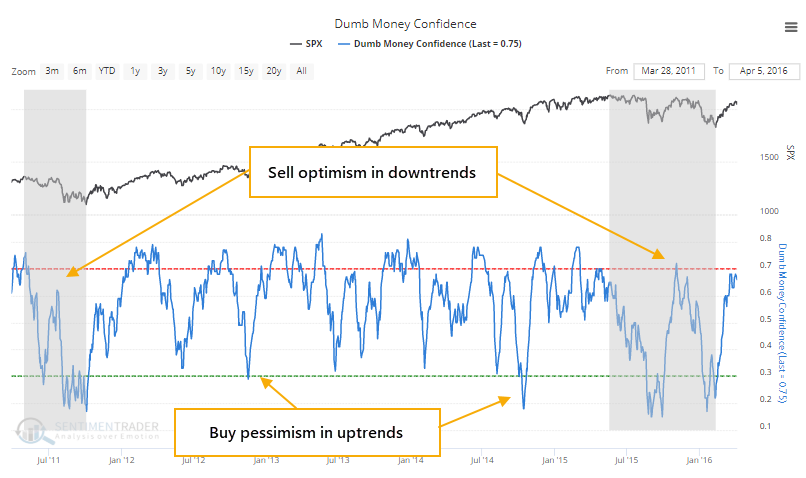
Like most things, the difficulty comes in the implementation, where theory meets practice. The biggest challenge is defining pessimism and optimism, and determining what is healthy and what is not.
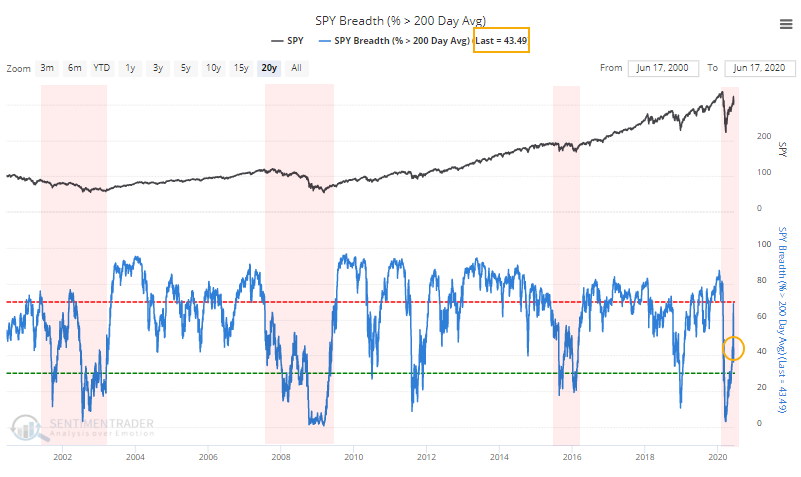
One of the better ways to define the latter is by watching how many stocks and indexes can maintain longer-term trends. The default tends to be the 200-day moving average, which in all of our testing has served about as well as any other trend measure, with the added bonus of being simple.
In prior years, we've suggested that markets are healthy when the percentage of stocks in the S&P 500 that are trading above their 200-day moving averages generally holds above 40%. Dips below that threshold typically see quick buying pressure. During unhealthy markets, this percentage usually stays below 60% or so, and forays above that level tend to lead to selling pressure.
This is a worry now.
Since February, most days have seen fewer than 60% of stocks in the S&P trading above their 200-day averages. It poked above that threshold a couple of weeks ago and then dropped right back below. That is not what typically happens during healthy markets.
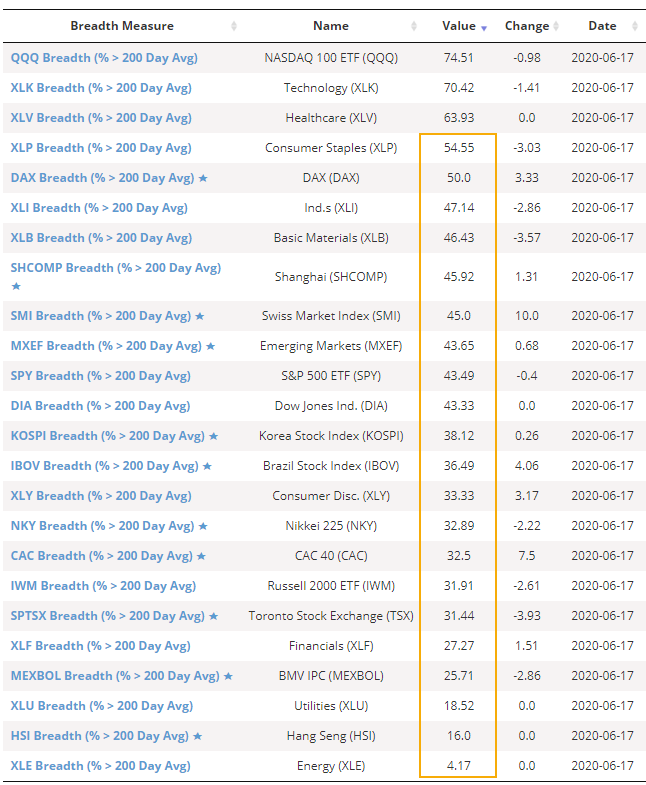
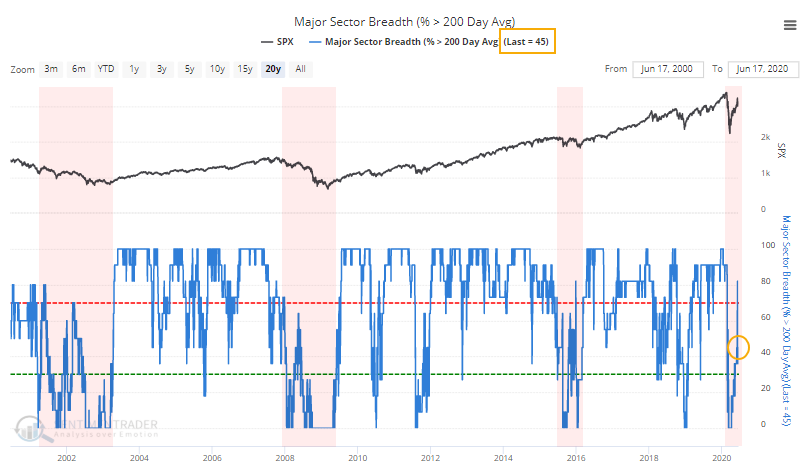
Almost all major sectors are still showing fewer than 60% of their component stocks trading above their long-term averages.
The same phenomenon can be seen among major industry groups.
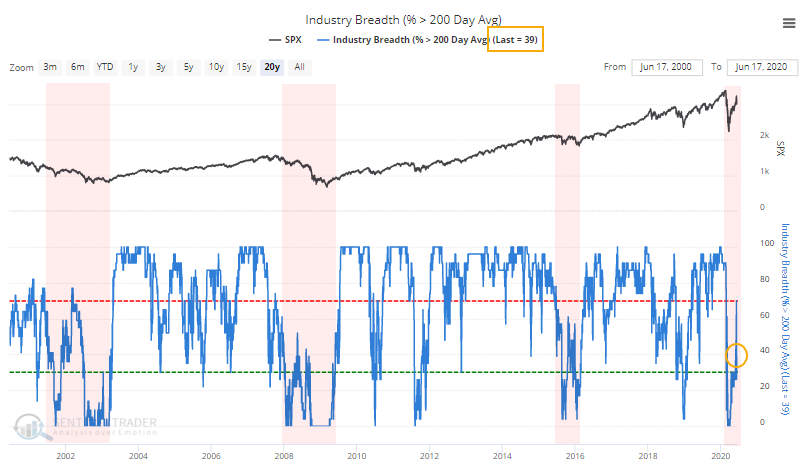
And sectors.
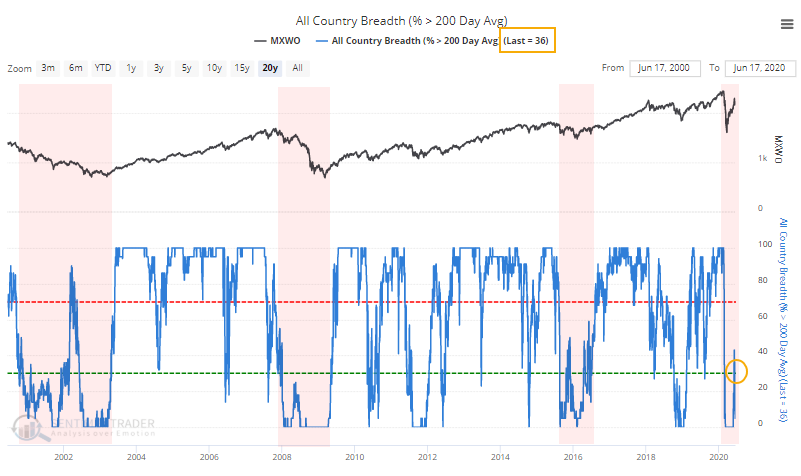
Even worldwide, with most major global indexes now trading below their 200-day averages again.
This isn't necessarily a death knell for the rally. Whenever we're in a period of extreme volatility, these figures can jump around some. They're not meant for day trading, they're meant to help us identify periods of long-term healthy and unhealthy markets, and we should watch how they behave over periods of weeks or even months.
High optimism is less worrisome during healthy markets. But so far, there is limited evidence that we've flipped to a healthy environment, so periods of excessive optimism should still be viewed as being troubling. By most accounts, that's what we're seeing now with Dumb Money Confidence hovering above 70%, which is why the short- to medium-term prospects for stocks is risky.