Moving average breadth
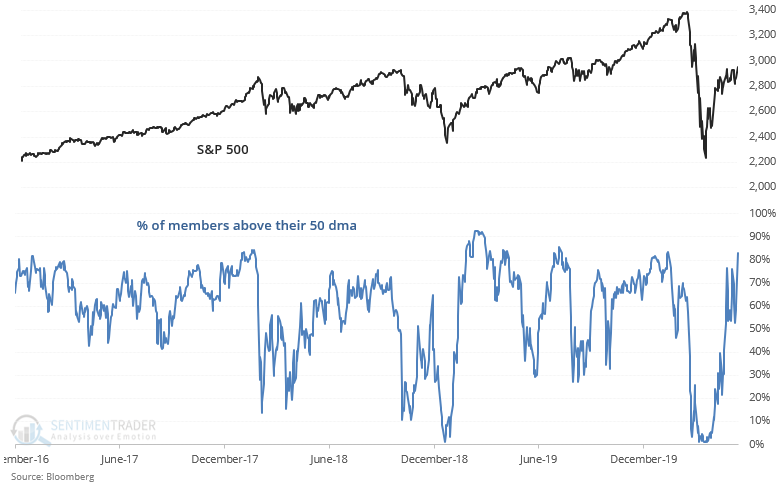
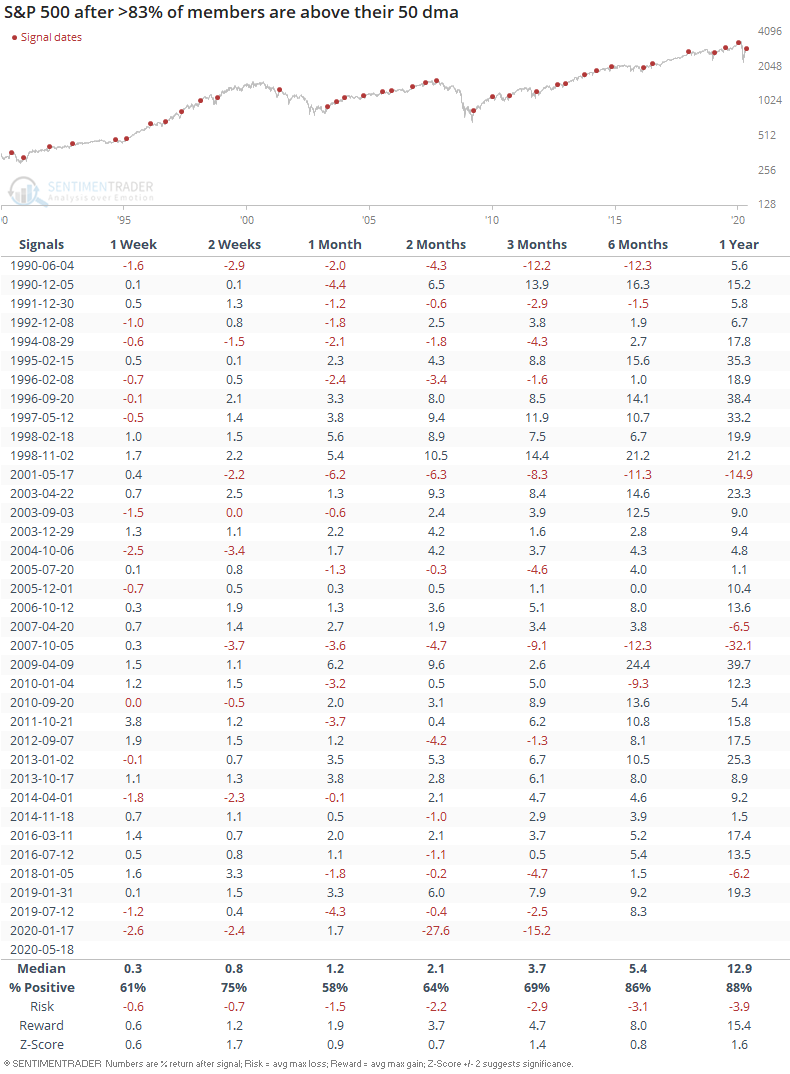
As U.S. stocks continue to rally, an increasing number of stocks are above key moving averages. For example, 83% of S&P 500 stocks are now above their 50 dma. The last time this happened was in January, a month before global equity markets peaked:
This may be a short term concern for stocks, but it isn't a long term concern. When this happened in the past, the S&P could pullback in the short term, but usually pushed higher over the next 6-12 months:
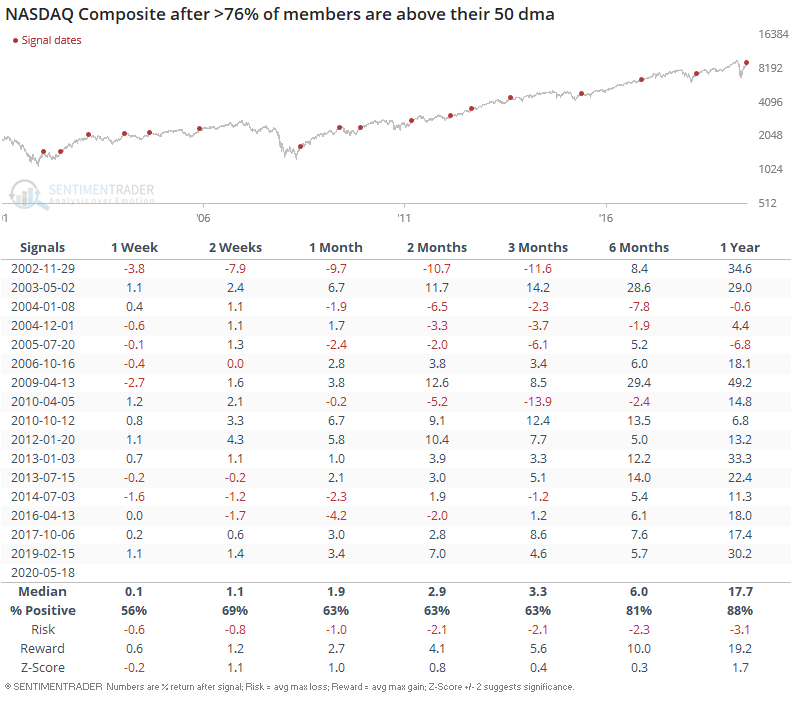
Similarly, more than 76% of NASDAQ members are above their 50 dma:
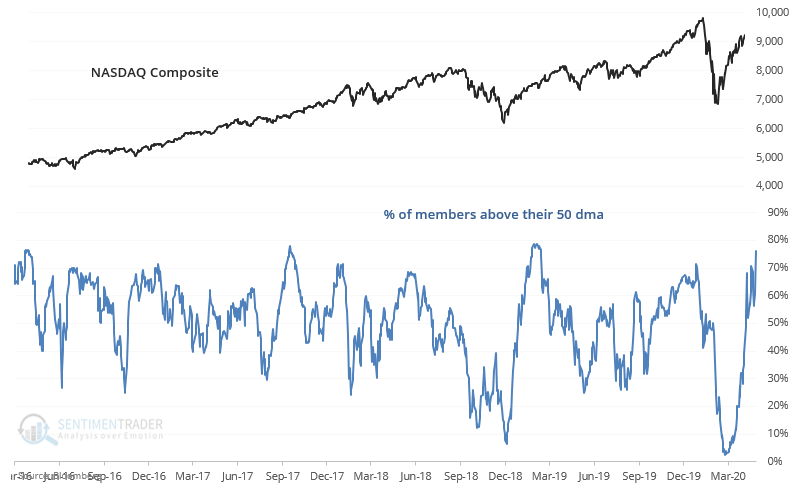
This could lead to short term losses, but usually led to more gains for the NASDAQ Composite over the next 6-12 months:
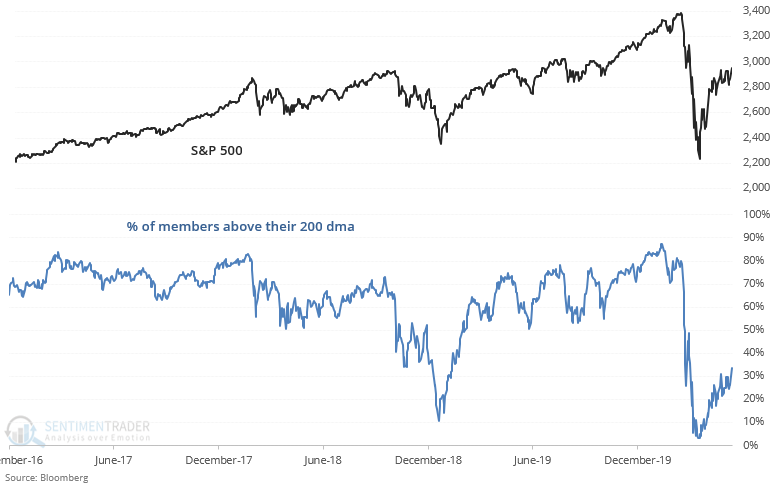
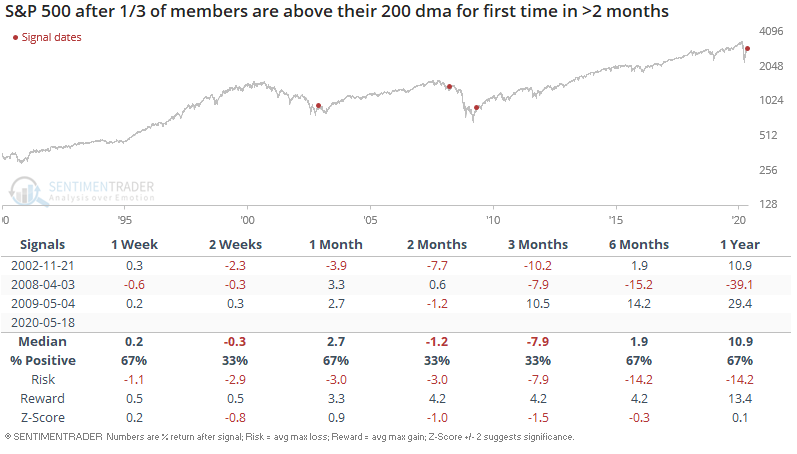
From a longer term perspective, 1/3 of S&P members are now above their long term moving average (200 dma).
When this happened for the first time in >2 months, the S&P's returns over the next few weeks and months leaned bearish as the market typically pulled back:
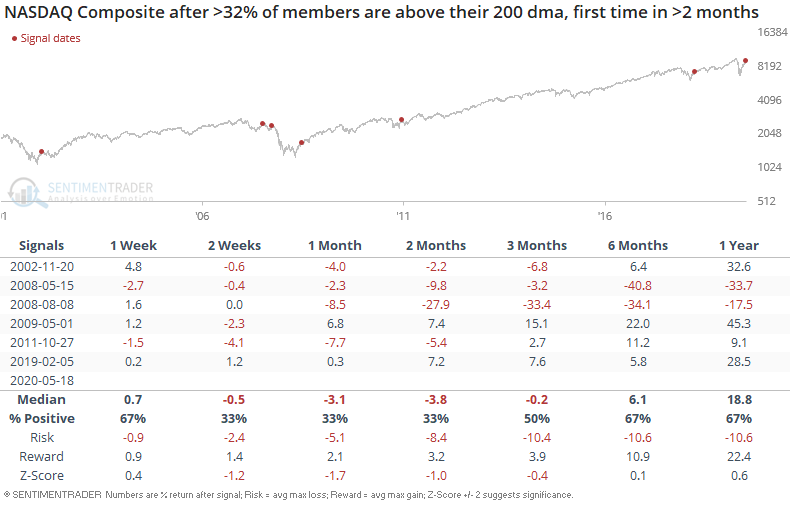
Similarly, an increasing number of NASDAQ Composite members are above their 200 dma:
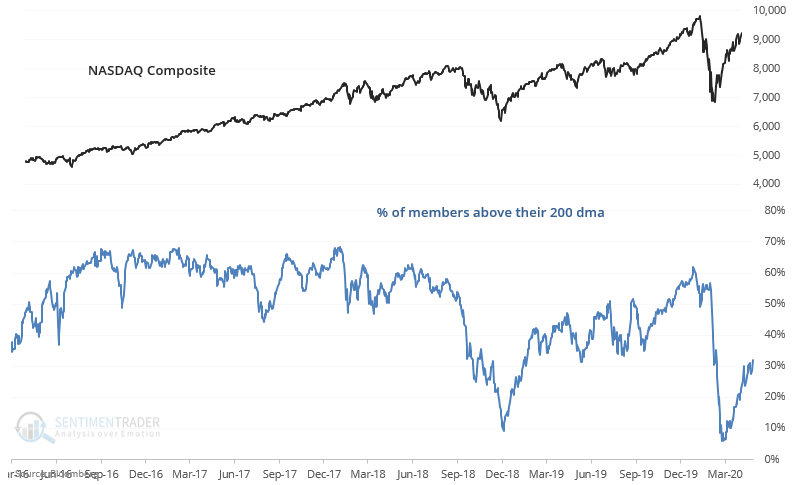
When this happened for the first time in more than 2 months, the NASDAQ usually pulled back over the next few weeks and months: