
NASDAQ Composite Index - McClellan Oscillator Reversal Signal

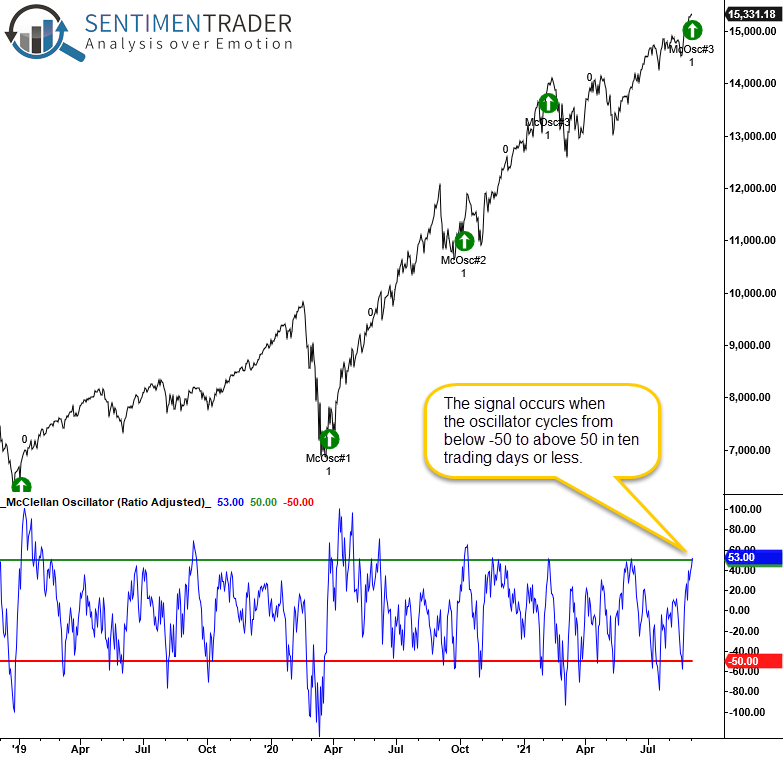
The NASDAQ Composite Index ratio adjusted McClellan oscillator registered an oversold to overbought reversal signal at the close of trading on 9/2/21. The reversal signal occurs when the oscillator cycles from below -50 to above 50 in ten trading days or less.
I'm a big fan of the reversal signal concept, especially when it occurs in a limited number of trading days. Martin Zweig, a famous investor, is widely known for creating the compressed period breadth reversal concept.
Let's assess the forward return outlook for the NASDAQ Composite when the ratio adjusted McClellan oscillator cycles from below -50 to above 50 in ten trading days or less.
CURRENT DAY CHART
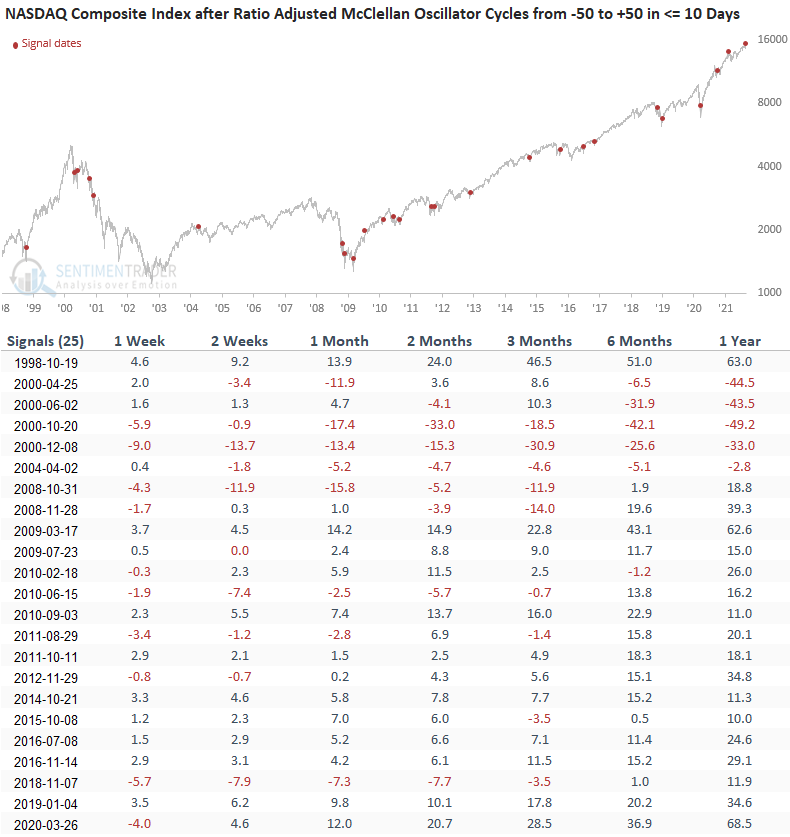
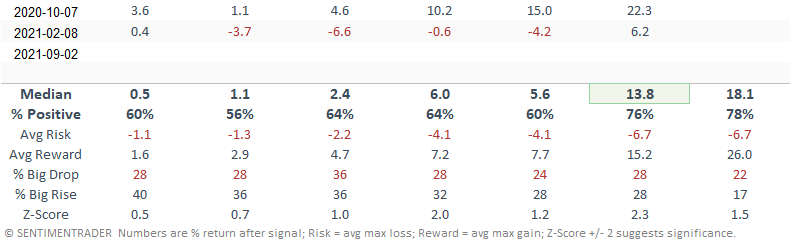
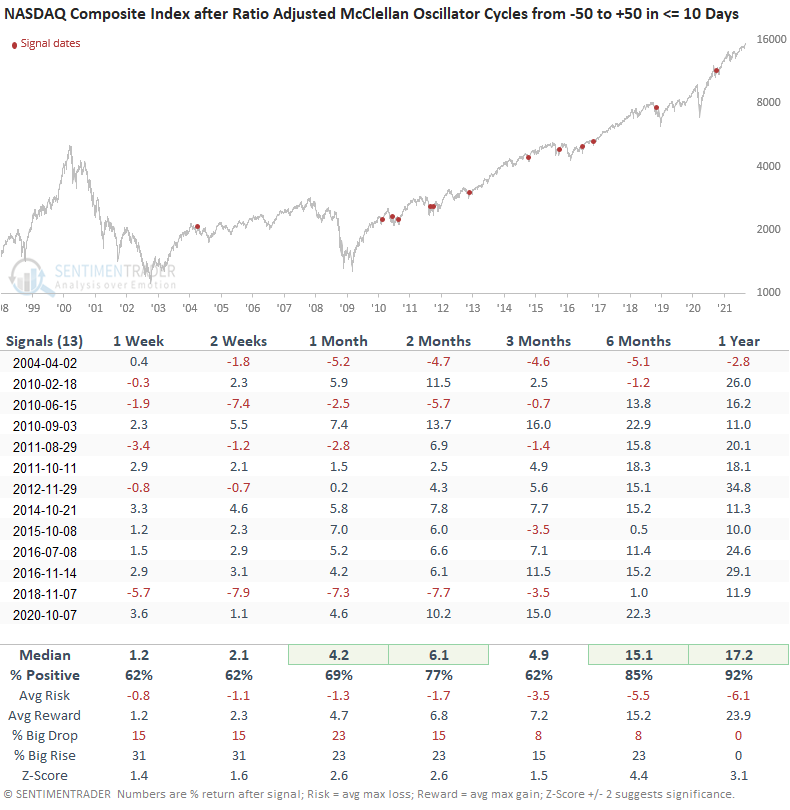
HOW THE SIGNALS PERFORMED - ALL SIGNALS
Performance looks in line on a short to intermediate-term basis. The 6-12 month periods look much better except for the 2000-02 bear market instances. The 1-year timeframe has registered 17 consecutive winning trades.
I would also note that between 1986-1998, the model did not register a single instance. One should always be mindful of market structure shifts that could potentially change the character of a trading signal. The move from fractions to decimals is one example.
Let's break the signals out by whether they occurred during a bear market, correction phase, or at a new high.
If you were wondering, the signal on 9/2/21 occurred at a new high.
HOW THE SIGNALS PERFORMED - BEAR MARKET
As the table shows, signals that occur near the outset of a bear market will struggle.
HOW THE SIGNALS PERFORMED - CORRECTION PHASE
The results for signals that occur during a market correction phase look excellent.
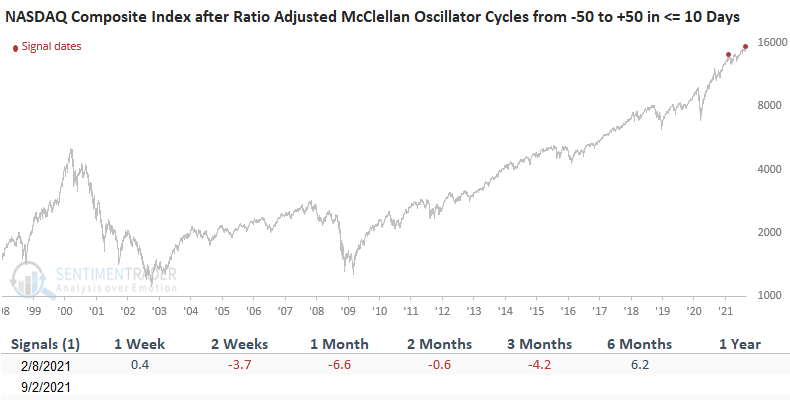
HOW THE SIGNALS PERFORMED - NEW HIGH
As the table shows, the only other signal to register when the NASDAQ composite simultaneously closed at a new high occurred on 2/8/21.
It's hard to gain an information edge with a sample size like this one.
Let's apply a trend filter to the McClellan oscillator reversal signal. We will keep the original parameters and add a condition that requires the NASDAQ Composite to be trading above its 200-day moving average when an alert occurs.
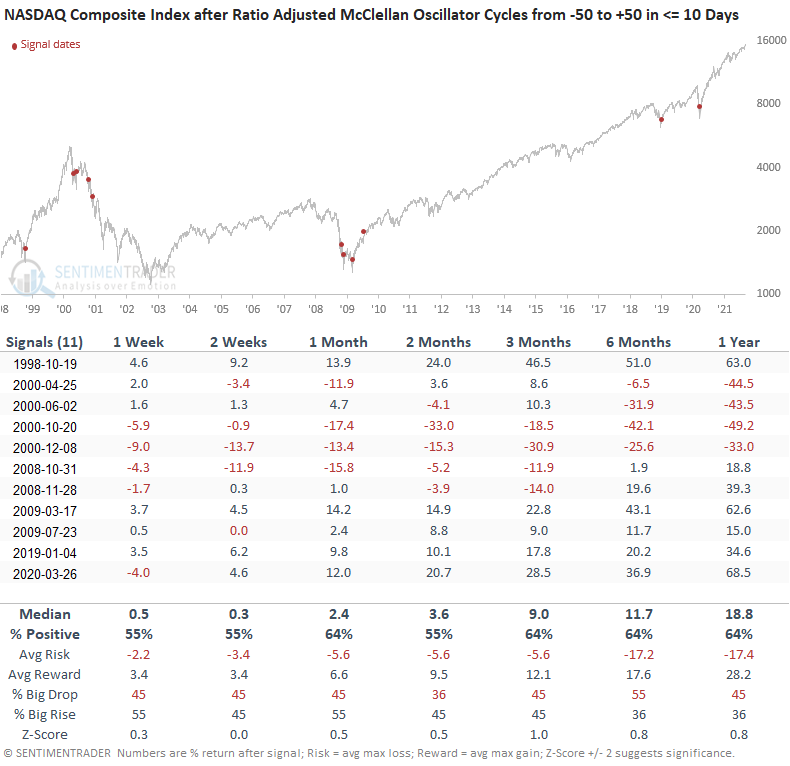
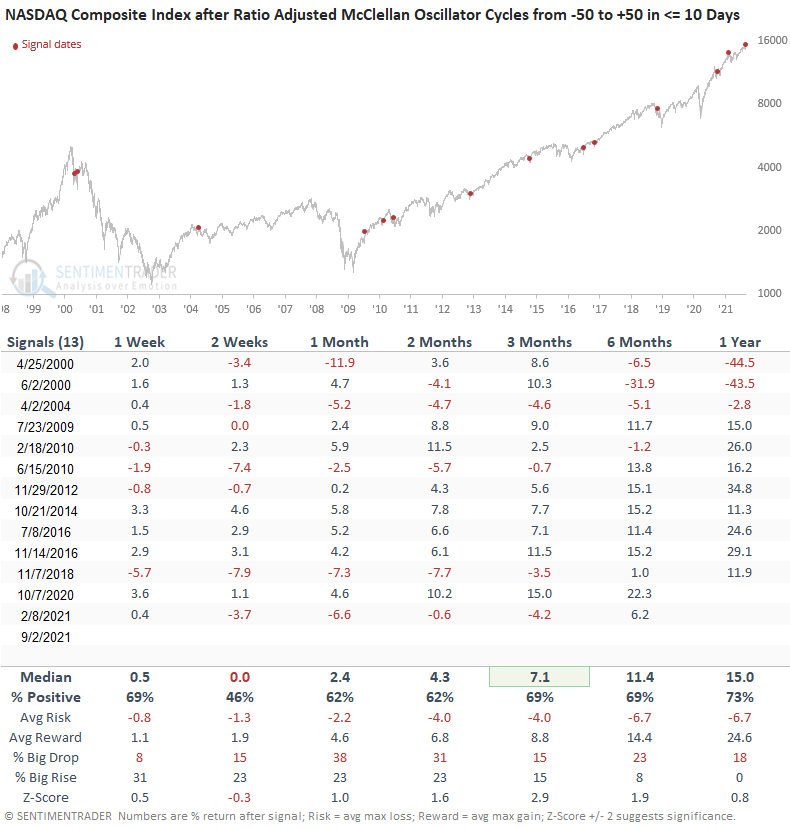
HOW THE SIGNALS PERFORMED - ABOVE 200-DAY MOVING AVERAGE
Besides the 2-week timeframe, the results look pretty good when the NASDAQ Composite is above its 200-day moving average, as is the case now.
As the data shows, I would much rather see a McClellan oscillator reversal signal occur after a correction phase. However, breadth thrust signals under most market conditions are rarely outright bearish.