
Nikkei 225 - The Momentum Continues

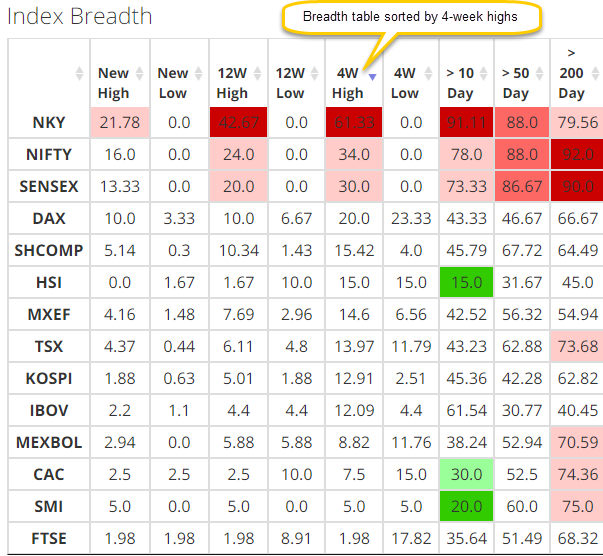
The market breadth table on the SentimenTrader website is an excellent place to review and compare breadth measures for domestic and global indexes.
As I scanned the global index table last night, I noticed several of the short-term Nikkei 225 breadth measures had improved by a material amount of late. One of the measures, the percentage of Nikkei 225 members registering a 4-week high, surged to 61.33% on 9/14/21.
In case you missed it, I shared two bullish momentum signals for the Nikkei 225 Index last week. Please click here and here.
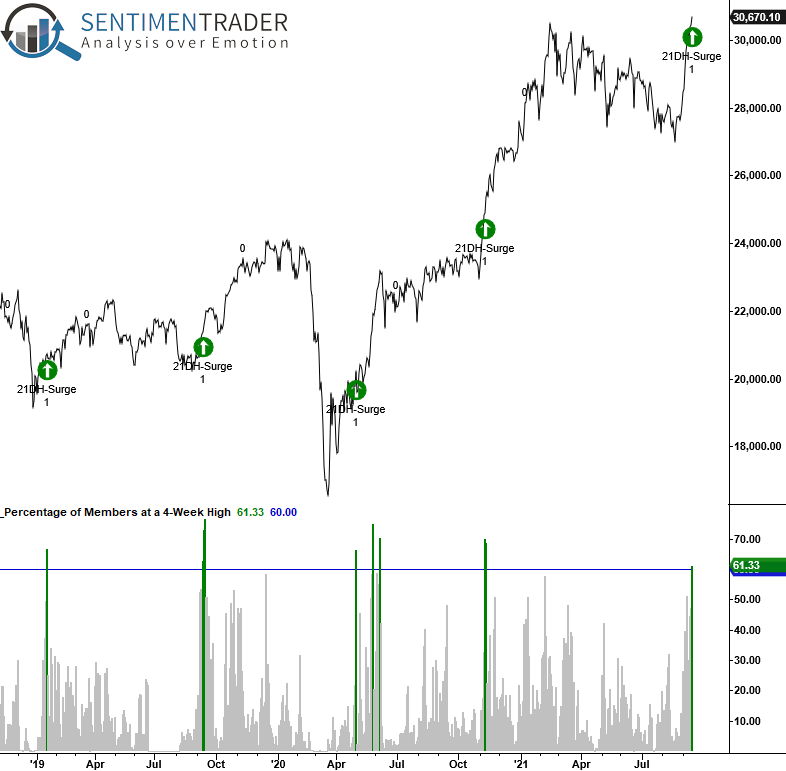
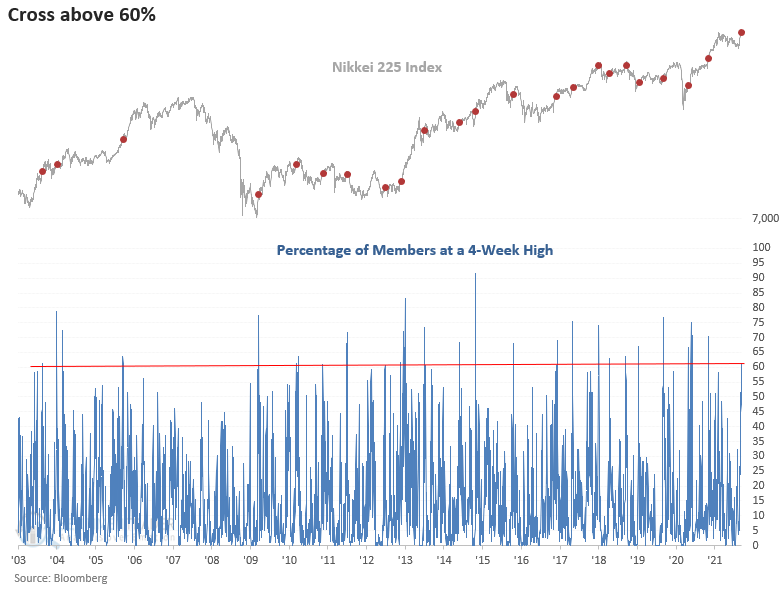
Let's assess if the surge in 4-week highs keeps the bullish momentum going for the Nikkei 225 Index. The study will identify when the number of Nikkei 225 members trading at a 4-week high surge above 60%.
GLOBAL INDEX BREADTH TABLE
You can find the breadth table in the Spotlights tab on the website. It's titled Spotlight on Breadth.
Once you identify a potential study on the breadth page, you can test the setup using the SentimenTrader.com backtest engine. Please click here for the Nikkei 225 Index 4-week high surge, which you can save to your favorites.
CURRENT DAY CHART
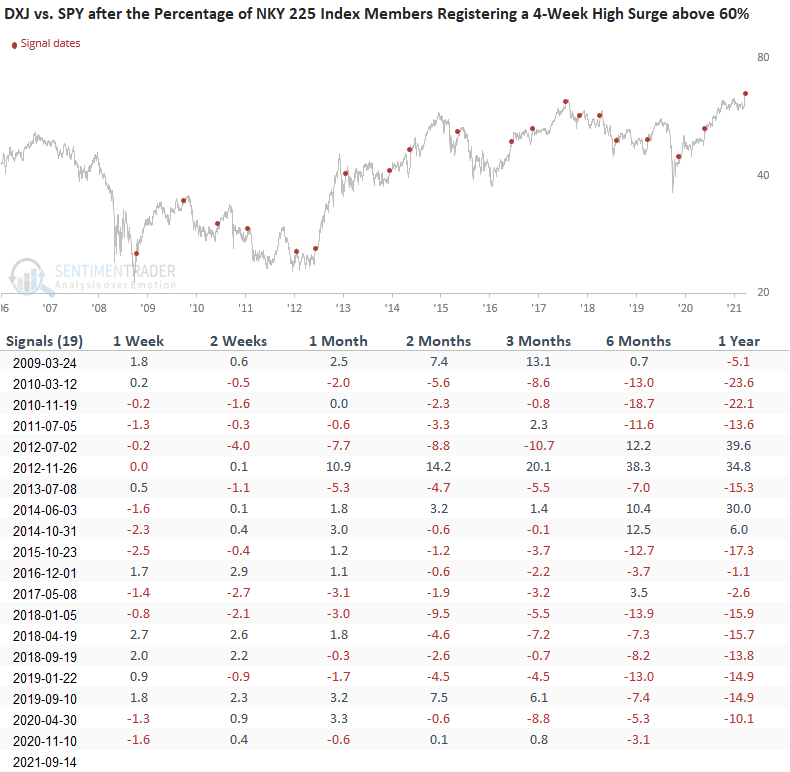
HISTORICAL CHART
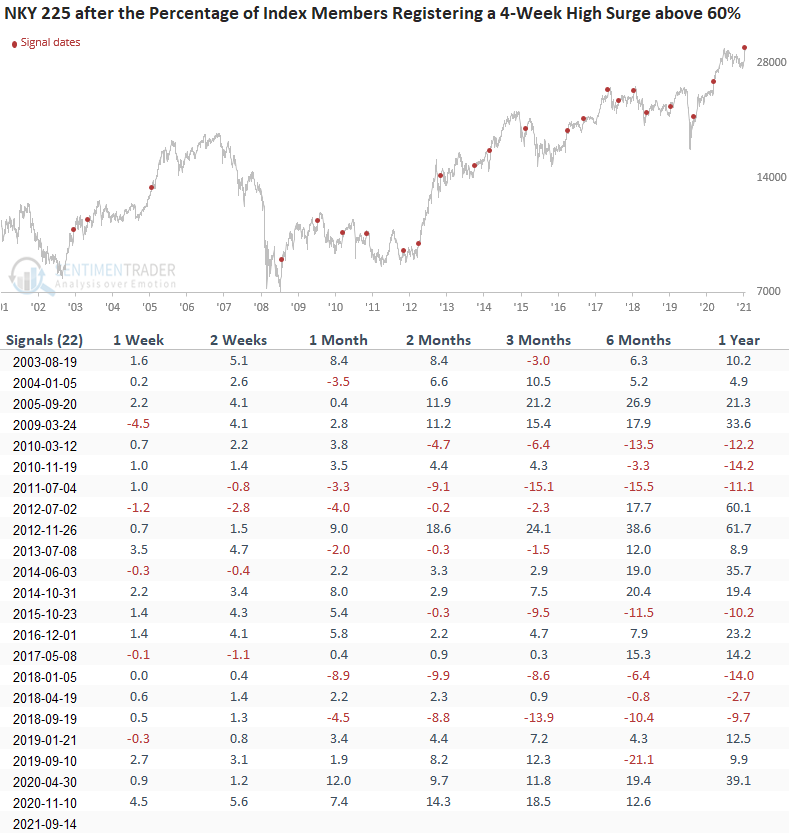
HOW THE SIGNALS PERFORMED
Results look good across all timeframes, especially the 2-week window.
Let's apply the same signals to the US dollar-denominated Japan ETF.
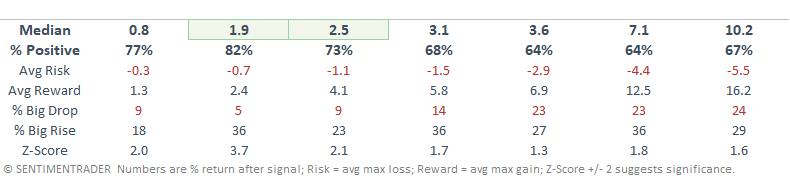
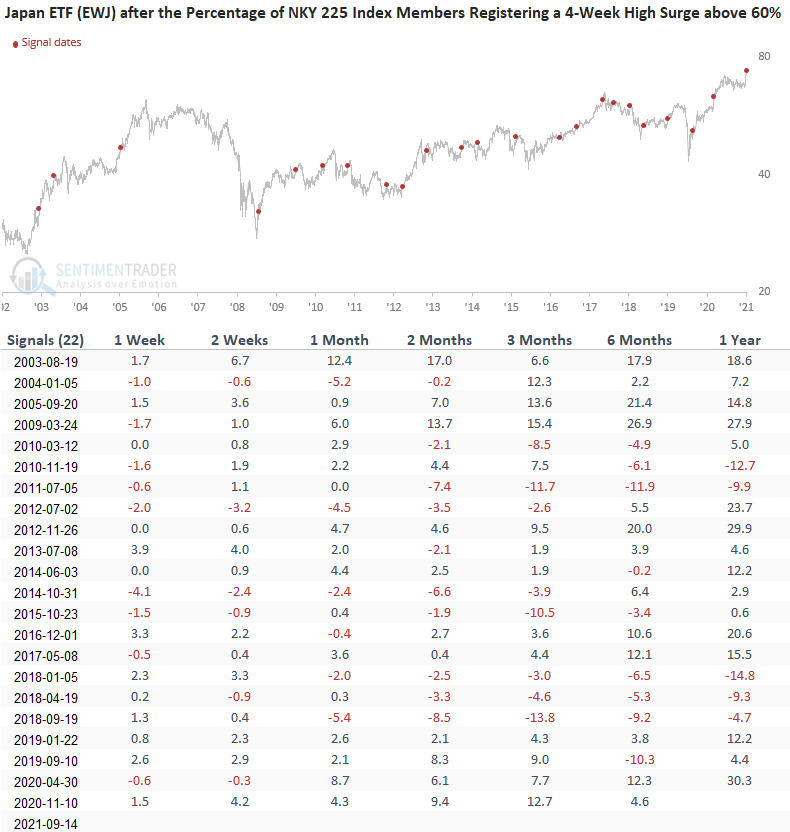
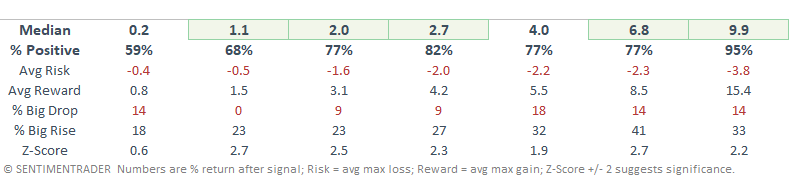
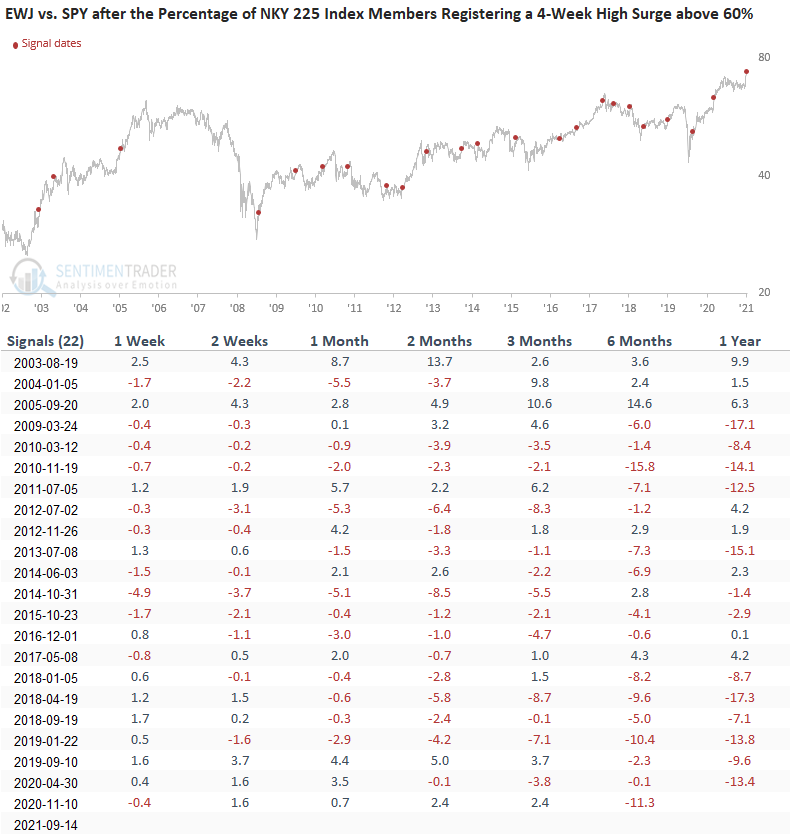
HOW THE SIGNALS PERFORMED - JAPAN ETF (EWJ)
Results look good across almost all timeframes, with several notable z-scores.
If you notice that two dates are slightly different from the first table, that's due to a signal occurring on a U.S. holiday.
Let's apply the same signals to the S&P 500 ETF.
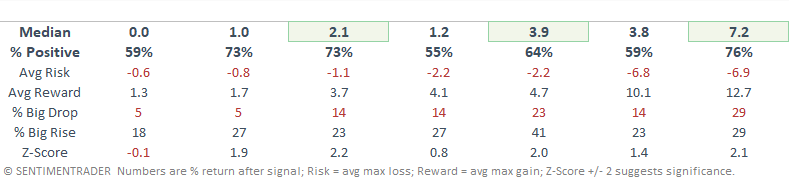
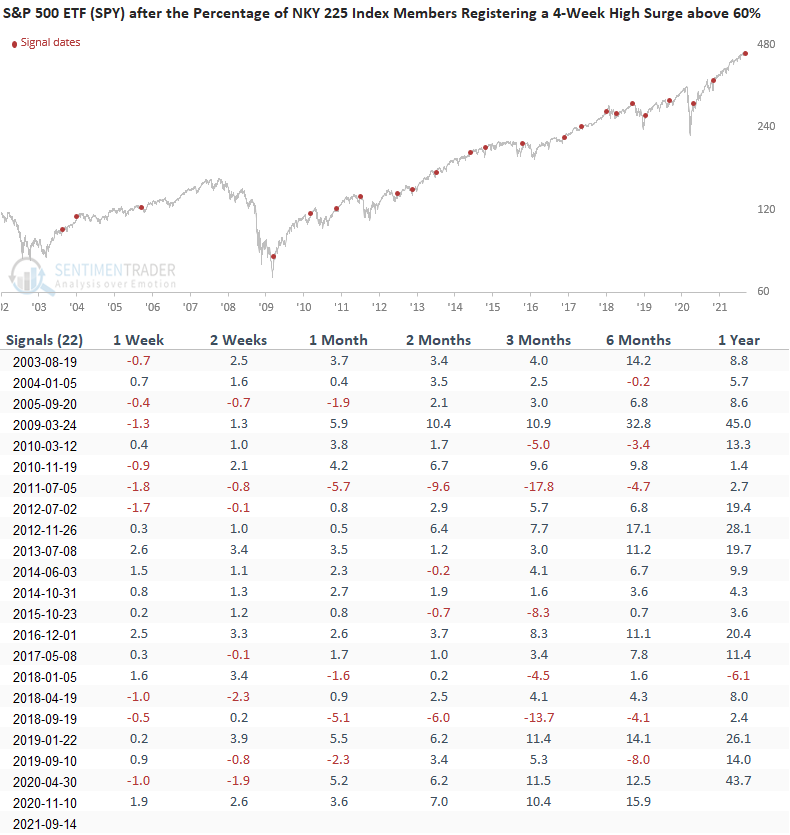
HOW THE SIGNALS PERFORMED - S&P 500 ETF (SPY)
Results for the S&P 500 ETF look even better than the EWJ ETF, especially the 1-year timeframe. It would appear that a momentum surge in the Nikkei provides a spark for the US.
I would also add that most signals occurred when both markets had corrected, which is not the case now. Before the current surge, the Nikkei had fallen by a little more than 11%. In contrast, the S&P has been registering new highs until recently.
Let's assess signal performance on a relative basis. We will now compare the EWJ ETF to the SPY ETF.
HOW THE SIGNALS PERFORMED - EWJ RELATIVE TO SPY
As the table shows, one would be better off buying the SPY ETF as it consistently outperforms the EWJ ETF.
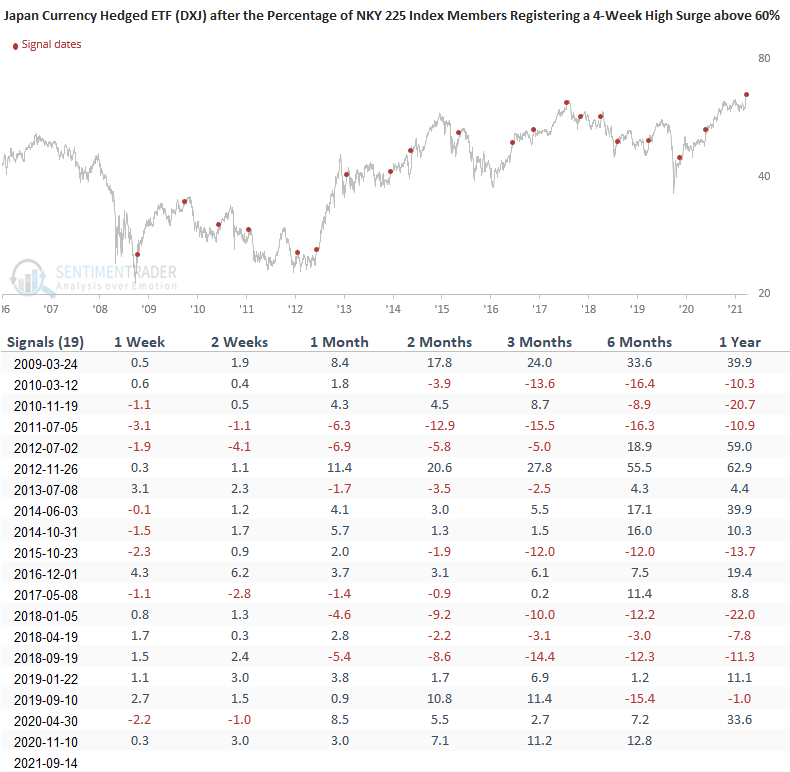
Let's look at the same signals, but this time we will assess the outlook for a currency-hedged Japan ETF. This type of ETF offers you a way to more fully access the return potential of Japanese equities in a weakening yen environment.
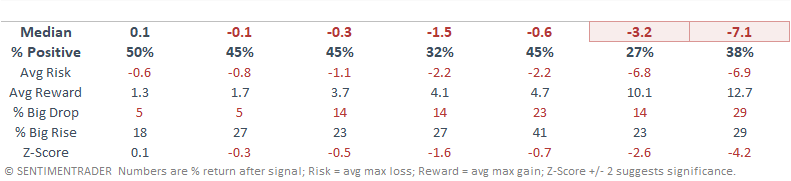
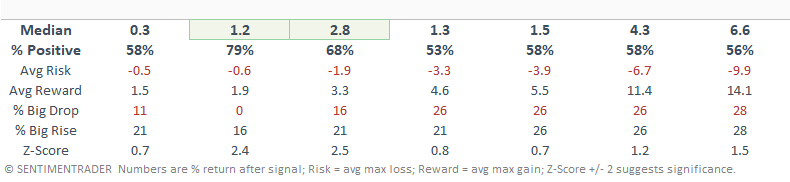
HOW THE SIGNALS PERFORMED - CURRENCY HEDGED ETF (DXJ)
Results look good in the 2-4 week timeframe and somewhat uninspiring in the other periods.
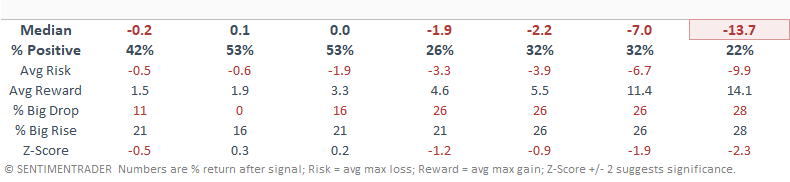
HOW THE SIGNALS PERFORMED - DXJ RELATIVE TO SPY
Once again, we see that the SPY ETF shows better relative performance. And, as I mentioned earlier, the current Nikkei signal is different from previous ones where the two markets corrected in unison.
Choosing the appropriate vehicle to play the surge in momentum depends on one's outlook for the dollar versus yen cross.