No Bank Failures; Battle Of Time Frames For Moving Averages

This is an abridged version of our Daily Report.
As good as it can get
Last year, there were no bank failures. That sounds like a good thing, and it’s happened only 3 other times in 85 years.
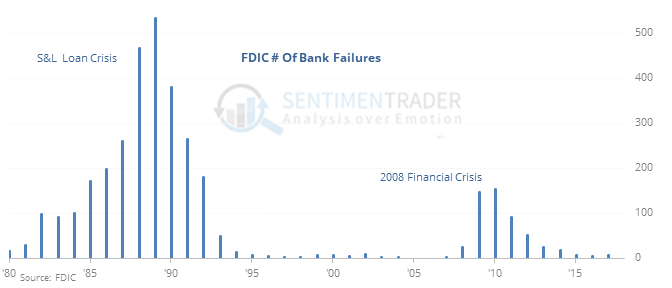
A sample size of 3 makes it difficult to consider the precedents, so if we relax the parameters and look for years when there were 3 or fewer bank failures, then we see that stocks did fine afterward, so there was no consistent suggestion that few failures necessarily bred trouble going forward. But returns were less than an any-time, random return across almost all time frames for the S&P 500 and Financials in particular. Returns following years with a high number of failures were much better.
Battle of time frames
More than 90% of S&P 500 stocks are in short-term uptrends, while more than two thirds are still in long-term downtrends.
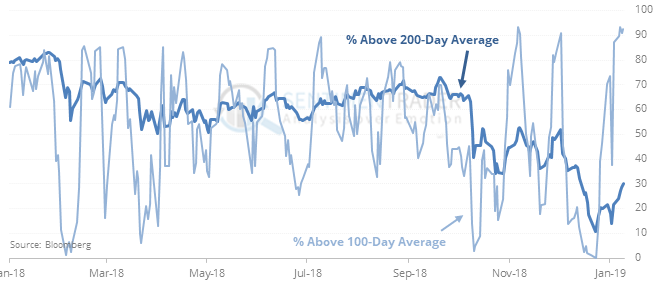
It is rare to see to this degree, and was a long-term positive. Sectors like Financials, Industrials, and Energy are seeing the same thing, with mostly good returns except for in Energy, which struggled mightily.
Earnings issues?
There have been 16 times when Q4 earnings reporting season began with the S&P 500 below its 200-day average. Of those 16, only 5 managed to rally during the season (about 27 days on average), for a 31% win rate, and an average return of -0.4%.
Slow drift
SPY closed at its highest price in a month on the lowest volume in a month. While below the 200-day average, it added to its gains over the next 3 days 5 out of 15 times, averaging -0.3%.
Reminder: The CoT data is still delayed due to the gov’t shutdown.