Nonfarm Payroll Miss > 50k

The BLS released the January employment report last Friday. The change in nonfarm payrolls showed an increase of 49k. According to Bloomberg, the median estimate from 75 economists called for a gain of 105k. Therefore, the difference between the actual and the survey showed a miss of 56k.
Let's look at equity, bond, and commodity performance when the NFP number shows a variance of -50k or more between the actual and survey to see if we can find an information edge.
Please note the following:
Bloomberg maintains survey data starting in 1997.
If the market was closed on the release day, I used the next trading day for results. Good Friday is an example of when employment numbers were released, and the market was closed.
Source: BLS & Bloomberg
Release Day Results
As the table below shows, 10-year bond futures, gold, and high yield bonds performed the best on an NFP miss of 50k or more. Economically sensitive groups like small-cap and commodities showed the weakest results. The high yield bond performance was the most surprising.
| Signal Date | SPX | Growth | Value | Small-Cap | TY Bond Fut | High Yield | SPGSCI | Gold | Actual | Survey | Net |
| 5/2/1997 | 1.81% | 2.11% | 1.68% | 2.40% | 0.09% | 0.17% | -1.03% | -0.03% | 142 | 195 | -53 |
| 6/6/1997 | 1.73% | 1.68% | 1.45% | 0.56% | 0.64% | 0.27% | -1.57% | 0.03% | 138 | 225 | -87 |
| 10/3/1997 | 0.48% | 0.53% | 0.47% | 0.59% | 0.03% | 0.14% | 1.78% | 1.02% | 215 | 332 | -117 |
| 4/3/1998 | 0.24% | 0.31% | 0.16% | -0.13% | 0.58% | 0.18% | 0.34% | 2.00% | -36 | 233 | -269 |
| 10/2/1998 | 1.64% | 0.96% | 2.19% | -0.06% | -0.03% | -0.21% | 0.98% | 0.23% | 69 | 200 | -131 |
| 11/5/1998 | 1.36% | 1.30% | 1.38% | 0.97% | -0.11% | 0.19% | 0.03% | 1.02% | 116 | 175 | -59 |
| 4/5/1999 | 2.12% | 2.24% | 1.70% | 0.89% | 0.63% | 0.23% | 0.69% | -0.60% | 46 | 150 | -104 |
| 6/4/1999 | 2.17% | 2.99% | 1.06% | 1.46% | 0.00% | -0.03% | 1.62% | -0.15% | 11 | 209 | -198 |
| 9/3/1999 | 2.89% | 3.18% | 2.60% | 1.98% | 0.68% | 0.14% | 1.26% | -0.47% | 124 | 220 | -96 |
| 10/8/1999 | 1.39% | 1.35% | 0.99% | -0.09% | 0.07% | 0.10% | -3.42% | -0.80% | -8 | 225 | -233 |
| 3/3/2000 | 1.98% | 2.77% | 1.33% | 2.43% | 0.21% | 0.06% | -0.10% | 0.20% | 43 | 213 | -170 |
| 6/2/2000 | 1.96% | 3.07% | 1.17% | 4.15% | 0.30% | 0.32% | 0.46% | 3.19% | 231 | 380 | -149 |
| 7/7/2000 | 1.53% | 1.88% | 1.09% | 0.93% | 0.32% | 0.10% | 0.84% | 0.00% | 11 | 250 | -239 |
| 8/4/2000 | 0.71% | 0.57% | 1.01% | 0.83% | 0.30% | 0.07% | 2.03% | -0.33% | -108 | 73 | -181 |
| 9/1/2000 | 0.20% | 0.42% | 0.29% | 0.75% | 0.37% | 0.04% | 0.37% | -0.43% | -105 | -23 | -82 |
| 12/8/2000 | 1.96% | 4.10% | 1.08% | 3.89% | -0.27% | 0.09% | -1.28% | -0.36% | 94 | 147 | -53 |
| 4/6/2001 | -2.00% | -2.66% | -1.73% | -2.26% | 0.69% | -0.12% | -0.65% | 0.70% | -86 | 60 | -146 |
| 5/4/2001 | 1.44% | 1.91% | 1.12% | 1.49% | 0.12% | 0.05% | -0.09% | -0.07% | -223 | 15 | -238 |
| 7/6/2001 | -2.35% | -3.00% | -1.69% | -1.92% | 0.39% | 0.06% | 2.39% | 0.30% | -114 | -50 | -64 |
| 9/7/2001 | -1.86% | -1.97% | -1.68% | -1.81% | 0.42% | -0.24% | 1.27% | 0.04% | -113 | -45 | -68 |
| 10/5/2001 | 0.16% | 0.69% | -0.60% | -0.50% | 0.06% | -0.18% | -0.83% | 0.31% | -199 | -100 | -99 |
| 11/2/2001 | 0.29% | 0.18% | 0.24% | -0.41% | -0.67% | 0.07% | -0.81% | 0.03% | -415 | -300 | -115 |
| 12/7/2001 | -0.75% | -1.18% | -0.34% | -0.21% | -0.97% | 0.01% | 1.20% | -0.11% | -331 | -200 | -131 |
| 8/2/2002 | -2.31% | -2.32% | -2.31% | -3.28% | 0.98% | -0.32% | 0.68% | 0.98% | 6 | 60 | -54 |
| 12/6/2002 | 0.63% | 0.53% | 0.71% | 0.58% | 0.35% | -0.23% | -0.86% | 0.46% | -40 | 36 | -76 |
| 1/10/2003 | 0.00% | 0.12% | -0.08% | 0.13% | -0.03% | 0.21% | -1.54% | 0.39% | -101 | 20 | -121 |
| 3/7/2003 | 0.83% | 0.81% | 0.77% | 0.10% | 0.23% | 0.11% | 1.11% | -1.64% | -308 | 10 | -318 |
| 4/4/2003 | 0.27% | -0.07% | 0.53% | -0.52% | -0.14% | 0.21% | -0.56% | 0.09% | -108 | -35 | -73 |
| 8/1/2003 | -1.03% | -0.98% | -1.09% | -1.67% | -0.07% | -0.52% | 3.71% | -2.25% | -44 | 10 | -54 |
| 9/5/2003 | -0.64% | -0.62% | -0.60% | -0.72% | 1.32% | 0.12% | -0.24% | 1.25% | -93 | 20 | -113 |
| 12/5/2003 | -0.77% | -0.96% | -0.63% | -0.94% | 1.10% | 0.24% | -1.40% | 0.76% | 57 | 150 | -93 |
| 1/9/2004 | -0.89% | -0.78% | -0.80% | -0.76% | 1.24% | 0.20% | 1.01% | 0.61% | 1 | 150 | -149 |
| 2/6/2004 | 1.26% | 1.39% | 1.23% | 2.55% | 0.69% | -0.06% | -1.11% | 1.36% | 112 | 175 | -63 |
| 3/5/2004 | 0.17% | -0.01% | 0.50% | 0.19% | 1.33% | 0.37% | 0.74% | 2.19% | 21 | 130 | -109 |
| 7/2/2004 | -0.32% | -0.48% | -0.10% | 0.05% | 0.76% | 0.19% | -0.35% | 0.58% | 112 | 250 | -138 |
| 8/6/2004 | -1.55% | -1.75% | -1.32% | -2.39% | 1.33% | 0.30% | -0.92% | 1.85% | 32 | 240 | -208 |
| 10/8/2004 | -0.75% | -1.13% | -0.38% | -1.19% | 0.71% | 0.22% | 1.16% | 1.19% | 96 | 148 | -52 |
| 12/3/2004 | 0.07% | 0.14% | 0.06% | -0.05% | 0.81% | 0.24% | -0.88% | 1.22% | 112 | 200 | -88 |
| 2/4/2005 | 1.10% | 1.16% | 1.13% | 1.29% | 0.56% | 0.22% | -0.17% | -0.62% | 146 | 200 | -54 |
| 4/1/2005 | -0.65% | -0.90% | -0.34% | -0.57% | 0.24% | 0.05% | 2.08% | -0.65% | 110 | 213 | -103 |
| 6/3/2005 | -0.69% | -0.88% | -0.44% | -0.79% | -0.52% | 0.13% | 2.05% | 0.23% | 78 | 175 | -97 |
| 7/8/2005 | 1.17% | 1.38% | 0.96% | 1.98% | -0.49% | 0.19% | -1.16% | 0.19% | 146 | 200 | -54 |
| 11/4/2005 | 0.02% | 0.17% | -0.16% | -0.09% | -0.04% | -0.06% | -1.41% | -0.87% | 56 | 120 | -64 |
| 1/6/2006 | 0.94% | 1.00% | 0.87% | 1.10% | -0.17% | 0.25% | 1.34% | 2.54% | 108 | 200 | -92 |
| 2/3/2006 | -0.54% | -0.59% | -0.50% | -0.28% | 0.12% | -0.03% | 1.02% | -0.90% | 193 | 250 | -57 |
| 5/5/2006 | 1.03% | 1.02% | 1.11% | 0.91% | 0.28% | 0.07% | 0.86% | 1.35% | 138 | 200 | -62 |
| 6/2/2006 | 0.20% | 0.00% | 0.42% | 2.15% | 0.79% | 0.20% | 2.30% | 1.18% | 75 | 170 | -95 |
| 7/7/2006 | -0.67% | -0.95% | -0.42% | 0.11% | 0.34% | 0.17% | -1.26% | -0.23% | 121 | 175 | -54 |
| 10/6/2006 | -0.27% | -0.32% | -0.26% | 1.31% | -0.59% | -0.04% | 0.62% | 0.23% | 51 | 120 | -69 |
| 9/7/2007 | -1.69% | -1.77% | -1.56% | 0.31% | 0.95% | -0.01% | 0.25% | 0.72% | -4 | 100 | -104 |
| 1/4/2008 | -2.46% | -2.87% | -2.12% | -1.13% | 0.56% | -0.45% | -0.92% | -0.39% | 18 | 70 | -52 |
| 2/1/2008 | 1.22% | 1.30% | 1.41% | 2.56% | 0.28% | 0.25% | -2.11% | -1.56% | -17 | 70 | -87 |
| 3/7/2008 | -0.84% | -0.95% | -0.80% | -3.07% | 0.66% | -0.24% | -0.52% | -0.20% | -63 | 20 | -83 |
| 10/3/2008 | -1.35% | -0.97% | -1.96% | -5.05% | 0.43% | -0.58% | -0.39% | -1.31% | -159 | -105 | -54 |
| 12/5/2008 | 3.65% | 3.42% | 4.00% | -3.14% | -0.80% | -1.04% | -4.84% | -1.74% | -533 | -335 | -198 |
| 2/6/2009 | 2.69% | 2.42% | 3.18% | 1.47% | -0.45% | 0.09% | 0.84% | 0.01% | -598 | -540 | -58 |
| 7/2/2009 | -2.91% | -2.48% | -3.35% | -3.91% | 0.50% | 0.20% | -2.93% | -1.09% | -467 | -365 | -102 |
| 10/2/2009 | -0.45% | -0.31% | -0.70% | -0.61% | -0.04% | -0.35% | -1.17% | 0.36% | -263 | -175 | -88 |
| 1/8/2010 | 0.29% | 0.42% | 0.21% | 0.40% | 0.16% | 0.19% | 0.12% | 0.48% | -85 | 0 | -85 |
| 6/4/2010 | -3.44% | -3.31% | -3.69% | -5.00% | 1.13% | -0.13% | -3.10% | 0.64% | 431 | 536 | -105 |
| 8/6/2010 | -0.37% | -0.30% | -0.39% | -0.67% | 0.55% | 0.05% | -1.55% | 0.50% | -131 | -65 | -66 |
| 10/8/2010 | 0.61% | 0.78% | 0.52% | 1.40% | 0.14% | 0.10% | 2.21% | 0.77% | -95 | -5 | -90 |
| 12/3/2010 | 0.26% | 0.32% | 0.32% | 0.70% | 0.18% | 0.15% | 1.28% | 1.22% | 39 | 150 | -111 |
| 2/4/2011 | 0.29% | 0.49% | 0.08% | 0.19% | -0.72% | 0.13% | -1.04% | -0.30% | 36 | 146 | -110 |
| 6/3/2011 | -0.97% | -1.10% | -0.90% | -1.53% | 0.28% | -0.15% | 0.18% | 0.63% | 54 | 165 | -111 |
| 7/8/2011 | -0.70% | -0.49% | -0.87% | -0.65% | 1.02% | 0.09% | -0.76% | 0.75% | 18 | 105 | -87 |
| 9/2/2011 | -2.53% | -2.38% | -2.77% | -3.61% | 0.53% | 0.00% | -1.31% | 2.61% | 0 | 68 | -68 |
| 4/9/2012 | -1.14% | -1.04% | -1.26% | -1.80% | 0.90% | -0.20% | -0.62% | 0.85% | 120 | 205 | -85 |
| 6/1/2012 | -2.46% | -2.60% | -2.46% | -3.20% | 0.56% | -0.47% | -2.55% | 3.70% | 69 | 150 | -81 |
| 4/5/2013 | -0.43% | -0.54% | -0.28% | -0.26% | 0.24% | -0.08% | -0.75% | 1.51% | 88 | 190 | -102 |
| 1/10/2014 | 0.23% | 0.41% | 0.16% | 0.53% | 0.79% | 0.11% | 0.74% | 1.44% | 74 | 197 | -123 |
| 2/7/2014 | 1.33% | 1.48% | 1.13% | 1.14% | 0.29% | 0.18% | 1.34% | 0.45% | 113 | 180 | -67 |
| 9/5/2014 | 0.50% | 0.52% | 0.47% | 0.25% | 0.04% | -0.21% | -0.49% | 0.06% | 142 | 230 | -88 |
| 4/6/2015 | 0.66% | 0.71% | 0.62% | 0.39% | 0.19% | 0.21% | 3.04% | 1.47% | 126 | 245 | -119 |
| 10/2/2015 | 1.43% | 1.46% | 1.48% | 1.51% | 0.46% | -0.35% | 0.43% | 2.06% | 142 | 200 | -58 |
| 6/3/2016 | -0.29% | -0.26% | -0.37% | -0.55% | 0.79% | 0.12% | -0.14% | 2.50% | 38 | 160 | -122 |
| 4/7/2017 | -0.08% | -0.01% | -0.15% | 0.01% | -0.26% | 0.08% | 0.60% | 0.32% | 98 | 180 | -82 |
| 10/6/2017 | -0.11% | 0.08% | -0.29% | -0.12% | -0.10% | -0.02% | -1.72% | 0.13% | -33 | 80 | -113 |
| 11/3/2017 | 0.31% | 0.57% | 0.06% | -0.11% | 0.02% | -0.02% | 1.18% | -0.70% | 261 | 313 | -52 |
| 4/6/2018 | -2.19% | -2.29% | -2.01% | -1.92% | 0.38% | 0.02% | -1.06% | 0.57% | 103 | 185 | -82 |
| 10/5/2018 | -0.55% | -0.83% | -0.33% | -0.90% | -0.16% | -0.17% | -0.17% | 0.33% | 134 | 185 | -51 |
| 3/8/2019 | -0.21% | -0.16% | -0.27% | -0.11% | 0.08% | -0.23% | -0.36% | 1.13% | 20 | 180 | -160 |
| 6/7/2019 | 1.05% | 1.56% | 0.46% | 0.72% | 0.22% | 0.33% | 0.37% | 0.61% | 75 | 175 | -100 |
| 4/3/2020 | -1.51% | -1.59% | -1.62% | -3.11% | 0.18% | -0.84% | 4.35% | 0.49% | -701 | -100 | -601 |
| 10/2/2020 | -0.96% | -1.99% | 0.30% | 0.53% | -0.08% | -0.08% | -1.74% | -0.45% | 661 | 859 | -198 |
| 12/4/2020 | 0.88% | 0.63% | 1.28% | 2.37% | -0.19% | 0.20% | 0.48% | -0.06% | 245 | 460 | -215 |
| 1/8/2021 | 0.55% | 0.97% | 0.06% | -0.25% | -0.22% | 0.06% | 0.99% | -4.04% | -140 | 50 | -190 |
| 2/5/2021 | 0.39% | 0.41% | 0.55% | 1.40% | -0.08% | 0.15% | 0.75% | 1.22% | 49 | 105 | -56 |
| SPX | Growth | Value | Small | TY Bond Fut | High Yield | SPGSCI | Gold | ||||
| % Positive | 54.55% | 54.55% | 53.41% | 50.00% | 71.59% | 64.77% | 50.00% | 67.05% | |||
| Avg Gain | 0.05% | 0.09% | 0.02% | -0.11% | 0.28% | 0.01% | 0.01% | 0.37% | |||
| Median Gain | 0.18% | 0.15% | 0.07% | -0.02% | 0.26% | 0.08% | -0.03% | 0.33% |
1-Day Forward Results
As the table below shows, results improve across the board in the equity category as bond and gold performance drop off. Once again, high yield performance continues to surprise with a slight uptick.
| 1-Day Forward | SPX | Growth | Value | Small | TY Bond Fut | High Yield | SPGSCI | Gold | Actual | Survey | Net |
| 5/5/1997 | 2.12% | 2.53% | 1.81% | 2.37% | 0.03% | 0.18% | -0.39% | 0.79% | 142 | 195 | -53 |
| 6/9/1997 | 0.57% | 0.96% | 0.08% | 0.20% | -0.32% | 0.23% | -0.52% | 0.17% | 138 | 225 | -87 |
| 10/6/1997 | 0.79% | 0.52% | 0.97% | 0.46% | 0.28% | 0.21% | -2.27% | -0.68% | 215 | 332 | -117 |
| 4/6/1998 | -0.12% | -0.92% | 0.61% | -0.80% | -0.25% | 0.04% | -1.91% | 0.35% | -36 | 233 | -269 |
| 10/5/1998 | -1.40% | -2.17% | -1.29% | -3.70% | 0.66% | -0.23% | -0.45% | -1.25% | 69 | 200 | -131 |
| 11/6/1998 | 0.63% | 0.91% | 0.33% | 0.87% | -0.69% | 0.09% | 0.20% | -0.12% | 116 | 175 | -59 |
| 4/6/1999 | -0.24% | -0.15% | -0.38% | -0.30% | 0.41% | 0.29% | -0.04% | 0.54% | 46 | 150 | -104 |
| 6/7/1999 | 0.51% | 0.18% | 1.04% | 1.02% | 0.03% | 0.08% | 1.82% | 0.00% | 11 | 209 | -198 |
| 9/6/1999 | 2.89% | 3.18% | 2.60% | 1.98% | 0.68% | 0.14% | 1.26% | -0.47% | 124 | 220 | -96 |
| 10/11/1999 | -0.06% | 0.34% | -0.12% | 0.58% | 0.00% | 0.06% | 1.29% | -0.44% | -8 | 225 | -233 |
| 3/6/2000 | -1.27% | -0.96% | -1.30% | 0.59% | -0.24% | 0.08% | 1.20% | -0.31% | 43 | 213 | -170 |
| 6/5/2000 | -0.65% | -0.57% | -0.92% | 0.07% | 0.26% | 0.14% | -0.47% | 1.41% | 231 | 380 | -149 |
| 7/10/2000 | -0.22% | -0.35% | 0.04% | 0.50% | -0.16% | 0.15% | -1.03% | 0.53% | 11 | 250 | -239 |
| 8/7/2000 | 1.12% | 1.45% | 0.66% | 1.25% | -0.31% | 0.11% | -1.76% | 0.18% | -108 | 73 | -181 |
| 9/4/2000 | 0.20% | 0.42% | 0.29% | 0.75% | 0.37% | 0.04% | 0.37% | -0.43% | -105 | -23 | -82 |
| 12/11/2000 | 0.75% | 1.88% | 0.21% | 1.70% | -0.11% | 0.49% | 3.13% | -0.73% | 94 | 147 | -53 |
| 4/9/2001 | 0.81% | 0.82% | 0.86% | 1.61% | -0.21% | -0.06% | 0.92% | -0.65% | -86 | 60 | -146 |
| 5/7/2001 | -0.24% | -0.55% | -0.11% | -0.66% | 0.01% | 0.14% | -1.42% | 0.06% | -223 | 15 | -238 |
| 7/9/2001 | 0.69% | 0.86% | 0.33% | 0.56% | 0.18% | -0.11% | -1.14% | 0.33% | -114 | -50 | -64 |
| 9/10/2001 | 0.62% | 0.87% | 0.21% | -1.00% | -0.20% | -0.02% | -0.75% | -0.51% | -113 | -45 | -68 |
| 10/8/2001 | -0.83% | -0.63% | -0.95% | -0.67% | 0.00% | 0.34% | 0.30% | 0.31% | -199 | -100 | -99 |
| 11/5/2001 | 1.44% | 1.78% | 1.12% | 1.03% | 0.37% | 0.23% | -1.43% | -0.46% | -415 | -300 | -115 |
| 12/10/2001 | -1.59% | -1.73% | -1.30% | -1.46% | 0.27% | -0.30% | -1.12% | -0.62% | -331 | -200 | -131 |
| 8/5/2002 | -3.43% | -3.37% | -3.47% | -2.48% | 0.22% | -0.38% | -1.23% | 0.19% | 6 | 60 | -54 |
| 12/9/2002 | -2.22% | -2.31% | -2.06% | -2.63% | 0.32% | -0.04% | 0.36% | -0.18% | -40 | 36 | -76 |
| 1/13/2003 | -0.14% | -0.11% | -0.16% | -0.06% | 0.25% | 0.25% | 0.87% | 0.11% | -101 | 20 | -121 |
| 3/10/2003 | -2.58% | -2.41% | -2.62% | -1.74% | 0.29% | 0.15% | -2.09% | 1.15% | -308 | 10 | -318 |
| 4/7/2003 | 0.12% | 0.12% | 0.14% | 0.88% | -0.38% | 0.32% | -0.56% | -1.16% | -108 | -35 | -73 |
| 8/4/2003 | 0.27% | 0.23% | 0.19% | -0.71% | 1.00% | 0.18% | -1.31% | 0.89% | -44 | 10 | -54 |
| 9/8/2003 | 1.00% | 1.20% | 0.86% | 1.62% | -0.17% | 0.19% | -0.11% | -0.66% | -93 | 20 | -113 |
| 12/8/2003 | 0.73% | 0.66% | 0.79% | 0.75% | -0.33% | 0.18% | 3.86% | 0.05% | 57 | 150 | -93 |
| 1/12/2004 | 0.48% | 0.57% | 0.40% | 1.36% | 0.04% | 0.14% | -0.10% | 0.00% | 1 | 150 | -149 |
| 2/9/2004 | -0.26% | -0.36% | -0.04% | 0.24% | 0.18% | 0.42% | 0.67% | 0.79% | 112 | 175 | -63 |
| 3/8/2004 | -0.84% | -1.12% | -0.53% | -1.17% | 0.36% | 0.23% | -1.84% | -0.12% | 21 | 130 | -109 |
| 7/5/2004 | -0.32% | -0.48% | -0.10% | 0.05% | 0.76% | 0.19% | -0.35% | 0.58% | 112 | 250 | -138 |
| 8/9/2004 | 0.12% | -0.04% | 0.23% | -0.24% | -0.21% | 0.03% | 1.34% | 0.22% | 32 | 240 | -208 |
| 10/11/2004 | 0.20% | 0.32% | 0.11% | 0.33% | 0.00% | 0.06% | 0.58% | -0.26% | 96 | 148 | -52 |
| 12/6/2004 | -0.08% | -0.15% | 0.00% | -0.50% | 0.14% | 0.14% | 0.75% | -0.41% | 112 | 200 | -88 |
| 2/7/2005 | -0.11% | -0.08% | -0.14% | -0.13% | 0.10% | 0.23% | -1.46% | -0.12% | 146 | 200 | -54 |
| 4/4/2005 | 0.27% | 0.40% | 0.10% | 0.36% | 0.03% | -0.10% | -0.55% | -0.54% | 110 | 213 | -103 |
| 6/6/2005 | 0.12% | 0.13% | 0.14% | 0.42% | 0.14% | -0.30% | 0.06% | 0.61% | 78 | 175 | -97 |
| 7/11/2005 | 0.63% | 0.73% | 0.54% | 1.45% | 0.04% | 0.32% | -0.91% | 0.86% | 146 | 200 | -54 |
| 11/7/2005 | 0.22% | 0.34% | 0.11% | 0.47% | 0.13% | 0.04% | -0.13% | 0.71% | 56 | 120 | -64 |
| 1/9/2006 | 0.37% | 0.47% | 0.32% | 0.98% | 0.00% | 0.27% | -0.99% | 1.89% | 108 | 200 | -92 |
| 2/6/2006 | 0.08% | -0.17% | 0.35% | 0.51% | -0.04% | 0.00% | -1.08% | 0.47% | 193 | 250 | -57 |
| 5/8/2006 | -0.08% | 0.06% | -0.15% | 0.92% | -0.07% | 0.10% | -0.41% | -0.45% | 138 | 200 | -62 |
| 6/5/2006 | -1.78% | -1.88% | -1.67% | 0.13% | -0.21% | -0.03% | -0.13% | 1.20% | 75 | 170 | -95 |
| 7/10/2006 | 0.15% | -0.15% | 0.33% | -1.57% | 0.01% | 0.18% | -0.56% | -0.95% | 121 | 175 | -54 |
| 10/9/2006 | 0.08% | 0.22% | 0.10% | -0.44% | 0.00% | 0.06% | 1.78% | 1.04% | 51 | 120 | -69 |
| 9/10/2007 | -0.13% | -0.14% | -0.26% | -2.16% | 0.21% | -0.01% | 1.13% | 0.35% | -4 | 100 | -104 |
| 1/7/2008 | 0.32% | 0.03% | 0.40% | -3.14% | 0.15% | -0.25% | -2.12% | -0.43% | 18 | 70 | -52 |
| 2/4/2008 | -1.05% | -0.86% | -1.18% | 2.41% | -0.20% | 0.13% | 1.15% | -0.45% | -17 | 70 | -87 |
| 3/10/2008 | -1.55% | -1.71% | -1.60% | -0.40% | 0.65% | -0.14% | 1.46% | -0.15% | -63 | 20 | -83 |
| 10/6/2008 | -3.85% | -4.22% | -3.77% | -2.86% | 1.70% | -2.02% | -6.24% | 3.96% | -159 | -105 | -54 |
| 12/8/2008 | 3.84% | 3.75% | 4.03% | 4.91% | -0.24% | 0.51% | 5.70% | 2.27% | -533 | -335 | -198 |
| 2/9/2009 | 0.15% | -0.10% | 0.37% | 3.43% | -0.22% | 0.29% | 1.04% | -2.35% | -598 | -540 | -58 |
| 7/6/2009 | 0.26% | 0.16% | 0.10% | -0.64% | 0.00% | -0.13% | -3.21% | -0.72% | -467 | -365 | -102 |
| 10/5/2009 | 1.49% | 1.02% | 2.10% | 1.88% | -0.03% | 0.22% | 0.68% | 1.34% | -263 | -175 | -88 |
| 1/11/2010 | 0.17% | 0.05% | 0.25% | -0.09% | 0.00% | 0.17% | -0.30% | 1.12% | -85 | 0 | -85 |
| 6/7/2010 | -1.35% | -1.37% | -1.51% | -2.44% | 0.09% | -0.07% | 0.08% | 1.90% | 431 | 536 | -105 |
| 8/9/2010 | 0.55% | 0.58% | 0.55% | 1.36% | -0.05% | 0.14% | 0.48% | -0.23% | -131 | -65 | -66 |
| 10/11/2010 | 0.01% | 0.03% | 0.06% | -0.05% | 0.10% | 0.07% | 0.16% | 0.68% | -95 | -5 | -90 |
| 12/6/2010 | -0.13% | -0.06% | -0.16% | 0.59% | 0.49% | 0.20% | 0.18% | 0.70% | 39 | 150 | -111 |
| 2/7/2011 | 0.62% | 0.56% | 0.72% | 1.03% | 0.03% | 0.21% | -0.35% | -0.06% | 36 | 146 | -110 |
| 6/6/2011 | -1.08% | -0.95% | -1.30% | -1.59% | 0.01% | -0.01% | -1.10% | 0.31% | 54 | 165 | -111 |
| 7/11/2011 | -1.81% | -1.75% | -2.03% | -2.23% | 0.67% | -0.20% | -0.78% | 0.52% | 18 | 105 | -87 |
| 9/5/2011 | -2.53% | -2.38% | -2.77% | -3.61% | 0.53% | 0.00% | -1.31% | 2.61% | 0 | 68 | -68 |
| 4/10/2012 | -1.71% | -1.77% | -1.80% | -2.40% | 0.35% | -0.17% | -1.52% | 1.02% | 120 | 205 | -85 |
| 6/4/2012 | 0.01% | 0.14% | -0.29% | -0.02% | -0.48% | -0.18% | 0.59% | -0.51% | 69 | 150 | -81 |
| 4/8/2013 | 0.63% | 0.66% | 0.65% | 0.89% | -0.22% | 0.08% | 0.64% | -0.22% | 88 | 190 | -102 |
| 1/13/2014 | -1.26% | -1.44% | -1.08% | -1.41% | 0.23% | 0.12% | -0.13% | 0.35% | 74 | 197 | -123 |
| 2/10/2014 | 0.16% | 0.29% | 0.06% | 0.20% | -0.02% | 0.15% | -0.41% | 0.93% | 113 | 180 | -67 |
| 9/8/2014 | -0.31% | -0.19% | -0.34% | 0.19% | -0.09% | 0.03% | -0.52% | -1.03% | 142 | 230 | -88 |
| 4/7/2015 | -0.21% | -0.21% | -0.27% | -0.57% | -0.05% | 0.27% | 1.14% | -0.66% | 126 | 245 | -119 |
| 10/5/2015 | 1.83% | 1.51% | 2.15% | 2.47% | -0.40% | 0.71% | 1.51% | 0.09% | 142 | 200 | -58 |
| 6/6/2016 | 0.49% | 0.36% | 0.67% | 1.09% | -0.07% | 0.38% | 1.27% | 0.36% | 38 | 160 | -122 |
| 4/10/2017 | 0.07% | 0.08% | 0.11% | 0.18% | 0.08% | 0.09% | 0.92% | -0.27% | 98 | 180 | -82 |
| 10/9/2017 | -0.18% | -0.08% | -0.30% | -0.44% | 0.05% | 0.05% | 0.16% | 0.79% | -33 | 80 | -113 |
| 11/6/2017 | 0.13% | 0.17% | 0.13% | 0.20% | 0.16% | 0.00% | 2.10% | 0.98% | 261 | 313 | -52 |
| 4/9/2018 | 0.33% | 0.28% | 0.30% | 0.08% | -0.09% | 0.11% | 1.85% | 0.30% | 103 | 185 | -82 |
| 10/8/2018 | -0.04% | -0.57% | 0.35% | -0.16% | 0.03% | 0.05% | -0.16% | -1.41% | 134 | 185 | -51 |
| 3/11/2019 | 1.47% | 1.70% | 1.24% | 1.77% | -0.09% | 0.19% | 0.80% | -0.20% | 20 | 180 | -160 |
| 6/10/2019 | 0.47% | 0.68% | 0.30% | 0.61% | -0.36% | 0.32% | -0.14% | -0.97% | 75 | 175 | -100 |
| 4/6/2020 | 7.03% | 7.55% | 6.55% | 8.24% | -0.53% | 0.39% | -1.36% | 2.93% | -701 | -100 | -601 |
| 10/5/2020 | 1.80% | 2.04% | 1.59% | 2.77% | -0.37% | 0.46% | 2.93% | 0.66% | 661 | 859 | -198 |
| 12/7/2020 | -0.19% | 0.36% | -0.56% | -0.06% | 0.24% | 0.11% | -0.56% | 1.41% | 245 | 460 | -215 |
| 1/11/2021 | -0.66% | -1.20% | 0.05% | -0.03% | -0.17% | -0.13% | -0.36% | 0.88% | -140 | 50 | -190 |
| 2/8/2021 | 49 | 105 | -56 | ||||||||
| SPX | Growth | Value | Small | TY Bond Fut | High Yield | SPGSCI | Gold | ||||
| % Positive | 56.32% | 55.17% | 60.92% | 57.47% | 52.87% | 73.56% | 44.83% | 55.17% | |||
| Avg Gain | 0.04% | 0.05% | 0.02% | 0.18% | 0.07% | 0.08% | -0.03% | 0.24% | |||
| Median Gain | 0.12% | 0.08% | 0.11% | 0.20% | 0.01% | 0.11% | -0.13% | 0.17% |
Release Day Results with a Negative NFP Number
While bond futures, gold, and high yield remain the best performers, each group's percent profitable level drops. The economically-sensitive groups perform even worse.
| Signal Date | SPX | Growth | Value | Small | TY Bond Fut | High Yield | SPGSCI | Gold | Actual | Survey | Net |
| 4/3/1998 | 0.24% | 0.31% | 0.16% | -0.13% | 0.58% | 0.18% | 0.34% | 2.00% | -36 | 233 | -269 |
| 10/8/1999 | 1.39% | 1.35% | 0.99% | -0.09% | 0.07% | 0.10% | -3.42% | -0.80% | -8 | 225 | -233 |
| 8/4/2000 | 0.71% | 0.57% | 1.01% | 0.83% | 0.30% | 0.07% | 2.03% | -0.33% | -108 | 73 | -181 |
| 9/1/2000 | 0.20% | 0.42% | 0.29% | 0.75% | 0.37% | 0.04% | 0.37% | -0.43% | -105 | -23 | -82 |
| 4/6/2001 | -2.00% | -2.66% | -1.73% | -2.26% | 0.69% | -0.12% | -0.65% | 0.70% | -86 | 60 | -146 |
| 5/4/2001 | 1.44% | 1.91% | 1.12% | 1.49% | 0.12% | 0.05% | -0.09% | -0.07% | -223 | 15 | -238 |
| 7/6/2001 | -2.35% | -3.00% | -1.69% | -1.92% | 0.39% | 0.06% | 2.39% | 0.30% | -114 | -50 | -64 |
| 9/7/2001 | -1.86% | -1.97% | -1.68% | -1.81% | 0.42% | -0.24% | 1.27% | 0.04% | -113 | -45 | -68 |
| 10/5/2001 | 0.16% | 0.69% | -0.60% | -0.50% | 0.06% | -0.18% | -0.83% | 0.31% | -199 | -100 | -99 |
| 11/2/2001 | 0.29% | 0.18% | 0.24% | -0.41% | -0.67% | 0.07% | -0.81% | 0.03% | -415 | -300 | -115 |
| 12/7/2001 | -0.75% | -1.18% | -0.34% | -0.21% | -0.97% | 0.01% | 1.20% | -0.11% | -331 | -200 | -131 |
| 12/6/2002 | 0.63% | 0.53% | 0.71% | 0.58% | 0.35% | -0.23% | -0.86% | 0.46% | -40 | 36 | -76 |
| 1/10/2003 | 0.00% | 0.12% | -0.08% | 0.13% | -0.03% | 0.21% | -1.54% | 0.39% | -101 | 20 | -121 |
| 3/7/2003 | 0.83% | 0.81% | 0.77% | 0.10% | 0.23% | 0.11% | 1.11% | -1.64% | -308 | 10 | -318 |
| 4/4/2003 | 0.27% | -0.07% | 0.53% | -0.52% | -0.14% | 0.21% | -0.56% | 0.09% | -108 | -35 | -73 |
| 8/1/2003 | -1.03% | -0.98% | -1.09% | -1.67% | -0.07% | -0.52% | 3.71% | -2.25% | -44 | 10 | -54 |
| 9/5/2003 | -0.64% | -0.62% | -0.60% | -0.72% | 1.32% | 0.12% | -0.24% | 1.25% | -93 | 20 | -113 |
| 9/7/2007 | -1.69% | -1.77% | -1.56% | 0.31% | 0.95% | -0.01% | 0.25% | 0.72% | -4 | 100 | -104 |
| 2/1/2008 | 1.22% | 1.30% | 1.41% | 2.56% | 0.28% | 0.25% | -2.11% | -1.56% | -17 | 70 | -87 |
| 3/7/2008 | -0.84% | -0.95% | -0.80% | -3.07% | 0.66% | -0.24% | -0.52% | -0.20% | -63 | 20 | -83 |
| 10/3/2008 | -1.35% | -0.97% | -1.96% | -5.05% | 0.43% | -0.58% | -0.39% | -1.31% | -159 | -105 | -54 |
| 12/5/2008 | 3.65% | 3.42% | 4.00% | -3.14% | -0.80% | -1.04% | -4.84% | -1.74% | -533 | -335 | -198 |
| 2/6/2009 | 2.69% | 2.42% | 3.18% | 1.47% | -0.45% | 0.09% | 0.84% | 0.01% | -598 | -540 | -58 |
| 7/2/2009 | -2.91% | -2.48% | -3.35% | -3.91% | 0.50% | 0.20% | -2.93% | -1.09% | -467 | -365 | -102 |
| 10/2/2009 | -0.45% | -0.31% | -0.70% | -0.61% | -0.04% | -0.35% | -1.17% | 0.36% | -263 | -175 | -88 |
| 1/8/2010 | 0.29% | 0.42% | 0.21% | 0.40% | 0.16% | 0.19% | 0.12% | 0.48% | -85 | 0 | -85 |
| 8/6/2010 | -0.37% | -0.30% | -0.39% | -0.67% | 0.55% | 0.05% | -1.55% | 0.50% | -131 | -65 | -66 |
| 10/8/2010 | 0.61% | 0.78% | 0.52% | 1.40% | 0.14% | 0.10% | 2.21% | 0.77% | -95 | -5 | -90 |
| 10/6/2017 | -0.11% | 0.08% | -0.29% | -0.12% | -0.10% | -0.02% | -1.72% | 0.13% | -33 | 80 | -113 |
| 4/3/2020 | -1.51% | -1.59% | -1.62% | -3.11% | 0.18% | -0.84% | 4.35% | 0.49% | -701 | -100 | -601 |
| 1/8/2021 | 0.55% | 0.97% | 0.06% | -0.25% | -0.22% | 0.06% | 0.99% | -4.04% | -140 | 50 | -190 |
| SPX | Growth | Value | Small | TY Bond Fut | High Yield | SPGSCI | Gold | ||||
| % Positive | 51.61% | 54.84% | 48.39% | 35.48% | 67.74% | 61.29% | 45.16% | 58.06% | |||
| Avg Gain | -0.09% | -0.08% | -0.10% | -0.65% | 0.17% | -0.07% | -0.10% | -0.21% | |||
| Median Gain | 0.16% | 0.12% | -0.08% | -0.25% | 0.18% | 0.05% | -0.24% | 0.04% |
Let's zoom out and take a look at the top two performers' results on more timeframes.
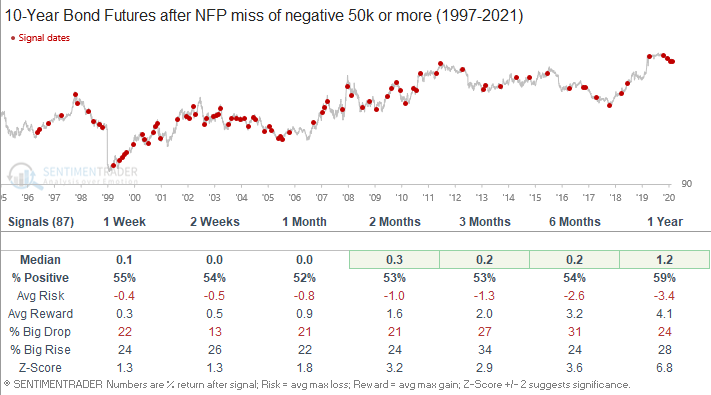
10-year Bond Futures Results
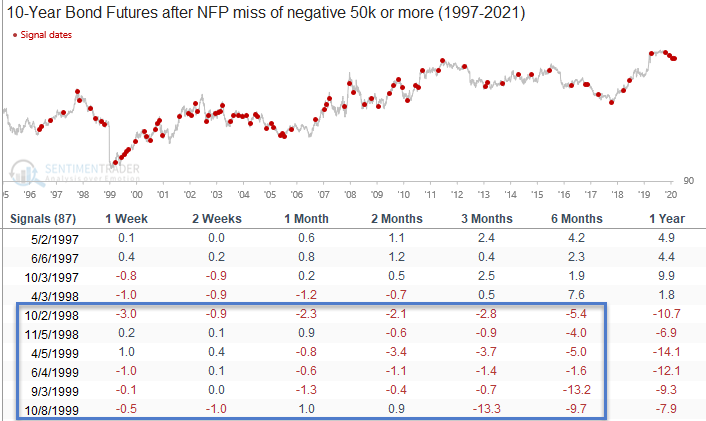
The bond performance continues to underwhelm relative to the release day numbers in the 1-4 week timeframe. I would ignore the long-term numbers as the underlying trend and environment can influence them. The 1998 LTCM market event provides a good example. Bond prices had been in an uptrend since 1996 and had a spike top in Q4 1998. As bonds turned down in late 1998 and into 1999, downside surprises in the NFP number had little to no impact on the 4-52 week timeframes. Please see the second table.
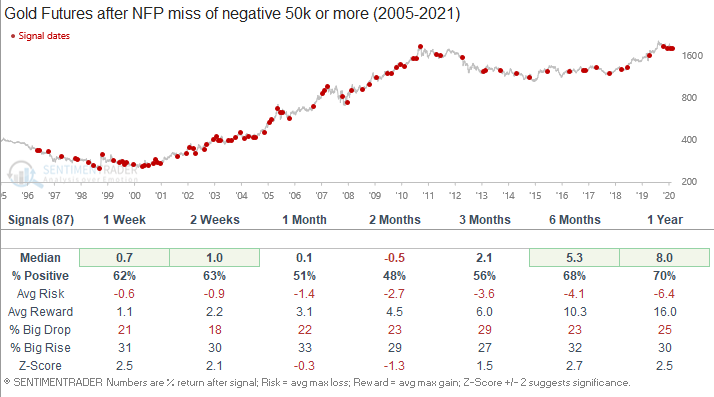
Gold Futures Results
Gold results remain pretty good in the 1-2 week timeframe. Once again, I would ignore the 6-12 month timeframe results as the decade-long uptrend from 2000-2010 skewed the numbers upward.
Final Thoughts
A downside surprise in the NFP headline number relative to expectations can provide a short-term edge in bonds and gold on the release day. However, results dropped off when I switched from Indices to ETFs and bought the open on the release day. In order to capture more of the information edge, one would need to buy just after the release in pre-market trading.
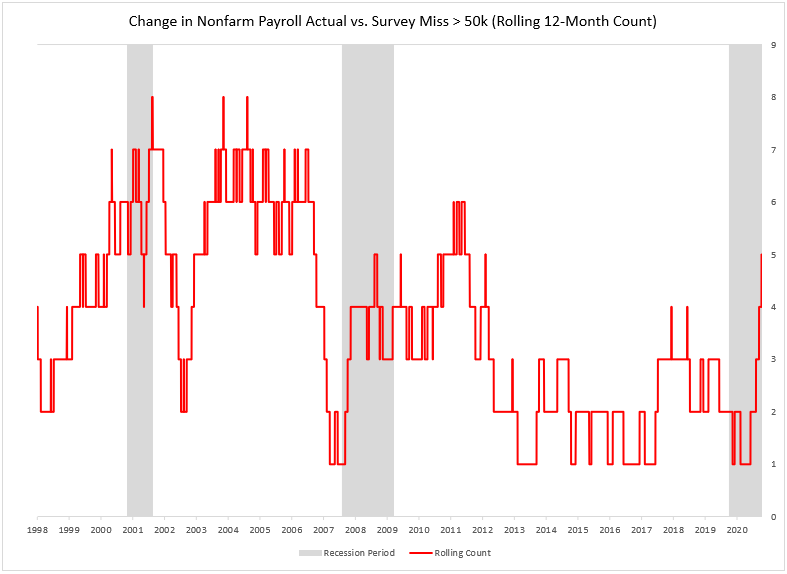
As I stated above, it's always important to understand the underlying market environment when assessing an information edge. As the chart below shows, the equity and bond market are currently ignoring the downside surprises relative to expectations in the NFP number. I think it's safe to say that both markets are looking through the numbers as the fiscal and monetary environment remain supportive.