
Nothing is oversold

For the first time in a long while, not a single domestic or overseas index, ETF, bond, or commodity we track is oversold.
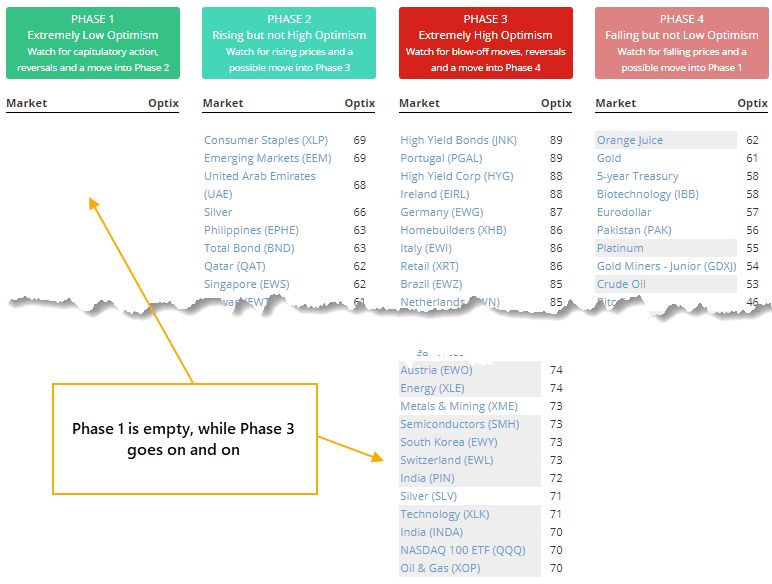
The Phase Table is showing that the Phase 1 column is totally blank. At the same time, the Phase 3 column, which shows funds displaying extremely high optimism, is lengthy.
Phases are determined by the level and direction of the Optimism Index (Optix) for each fund. To reduce noise, we use a 10-day average of the Optix for ETFs and a 5-day average for futures. If the Optix for a fund is in extreme pessimism territory, it goes into Phase 1. If it's in extreme optimism territory, Phase 3.
There haven't been many days over the past 15 years when there were no funds in Phase 1 and at least 35% of them were in Phase 3. All of these days have triggered since the financial crisis.
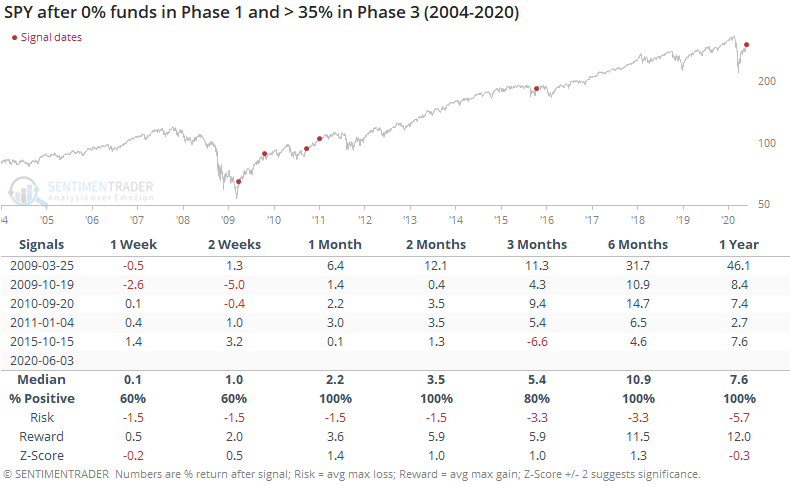
Since the past decade was dominated by a rising trend, it's no big surprise that forward returns were also positive. The risk/reward was good, and the z-score over the medium-term was also quite good. The z-score looks at returns after the signals compared to a random return, adjusting for the standard deviation among returns and the size of the sample. The higher the score, the more it suggests that the signal is showing us "something." It's harder to get a large z-score with a small sample size.
For bonds, it was a bad sign.
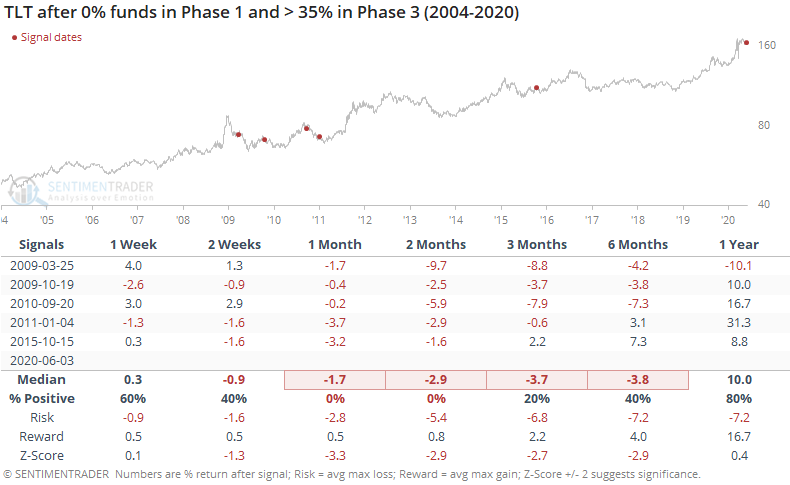
Even though TLT has been in a pretty steady uptrend during the study period, it showed a negative return over the next 1-2 months following these signals. When investors were in risk-on mode to such a degree that there was not a single market showing pessimism, it was a sign that bonds were not in favor.
This should be another good sign for stocks. We're not assigning a forecast and including it in the Active Studies only because of the small sample size.