
NYSE High Low Logic Risk-Off Model

The High Low Logic Index, created by Norman Fosback, is a classic market breadth indicator that seeks to identify a market environment when a high number of issues are simultaneously making new 52-week highs and lows. An elevated level of new highs and lows implies that market participation is inconsistent or out of gear. For a more detailed explanation of the High Low Logic concept, please see Jay's note from 3/4/21. The version of the High Low Logic Index that I use has the following modifications. I use a 40-day exponential moving average versus the original Fosback 50-day exponential moving average, and I added a spike in new lows as the final sell trigger. In my note today, I plan to review the version of the High Low Logic Index that I use as a component in the TCTM Risk Warning Model.
Components
1.) Percentage of NYSE 52-Week Highs
2.) Percentage of NYSE 52-Week Lows
NYSE High Low Logic Index Risk-Off Model
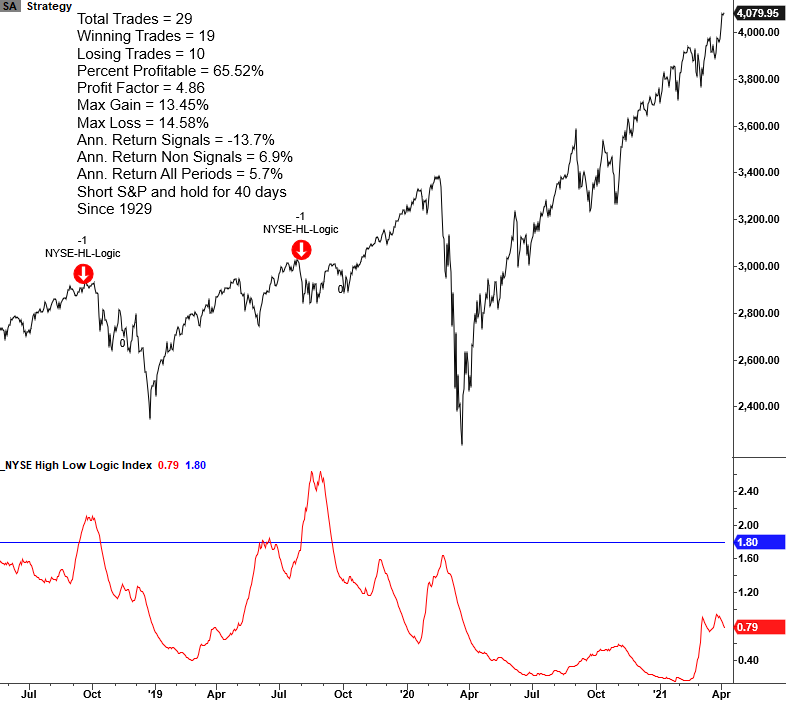
The NYSE High Low Logic Index Model seeks to identify instances in history when the Index exceeds a user-defined threshold, and new lows start to expand. The model will issue an alert based upon the following conditions.
Signal Criteria
Condition1 = High Low Logic Index >= 1.8%.
Condition2 = Percentage of NYSE Lows >=3.5%.
Condition3 = S&P 500 Index <= 3.75% from 252-Day High
Condition4 = High Low Logic Index resets below 1.5%. i.e., the reset screens out duplicate signals.
If Condition 1-4, signal risk-off.
Let's take a look at some charts and the historical signal performance.
Current Day Chart
Please note, I calculate performance statistics in the chart as a short signal, whereas annualized returns result from buying the S&P 500.
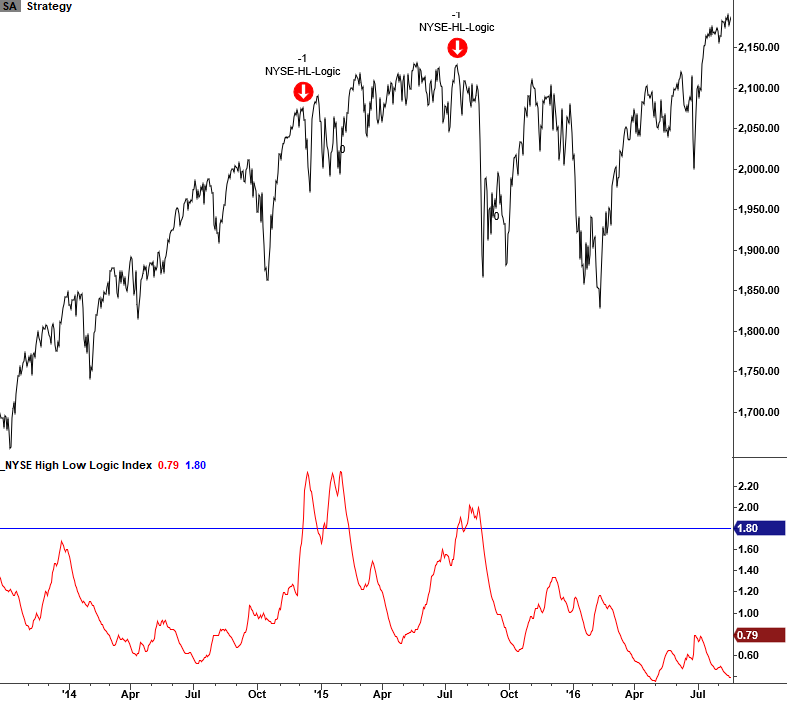
2015-16 Oil/Commodity
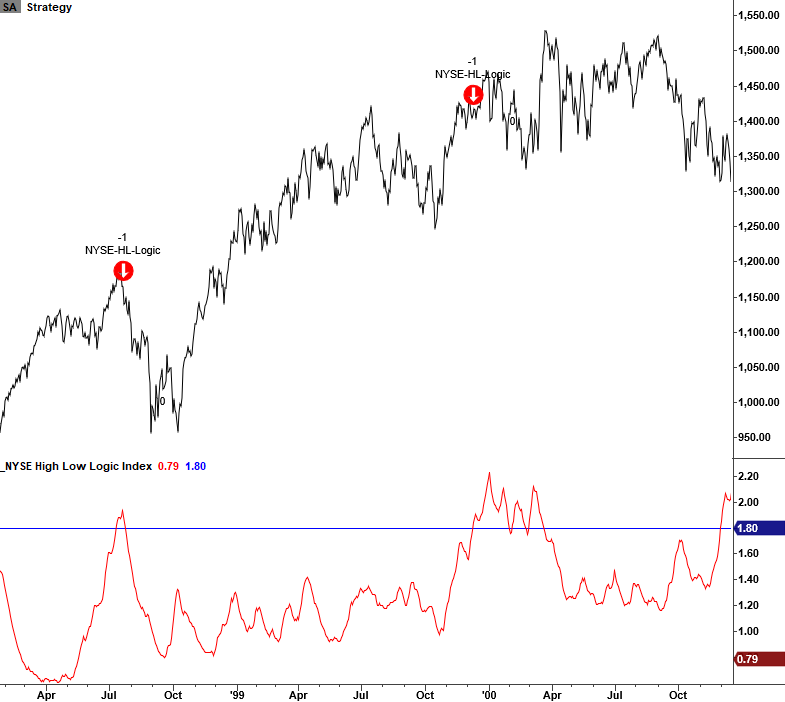
1998-2000 LTCM & Internet Bubble
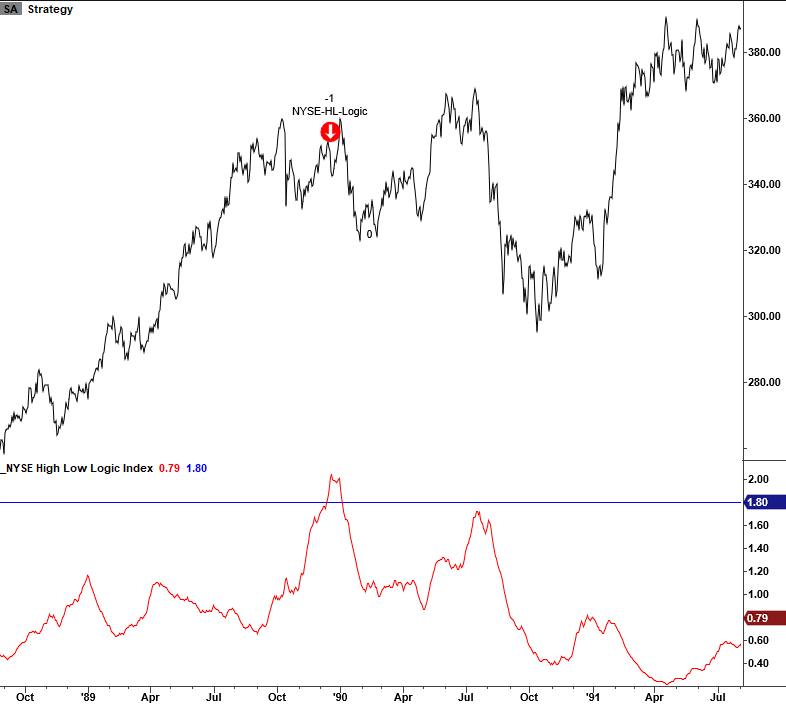
1990 Savings & Loan/Iraq Oil Spike
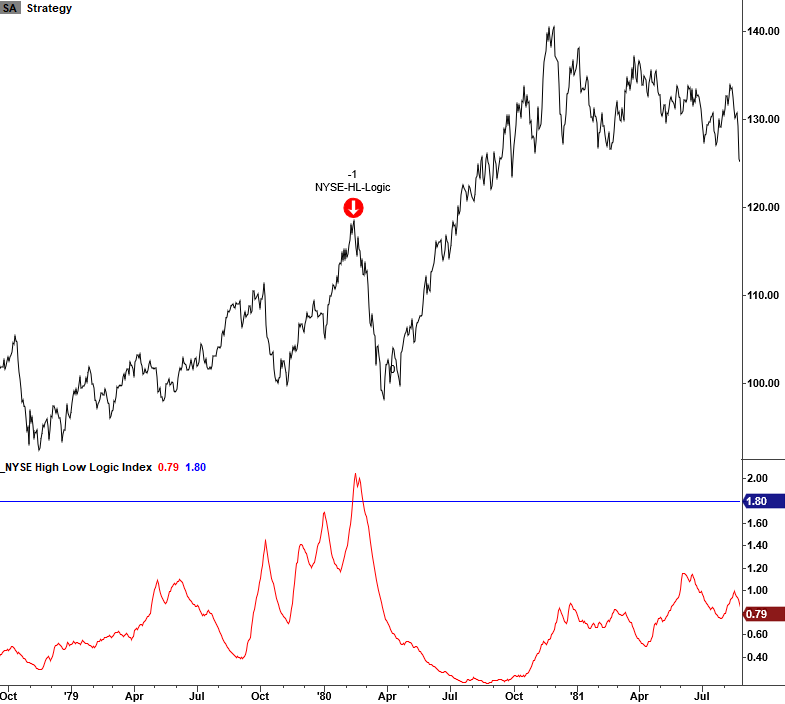
1980 Correction
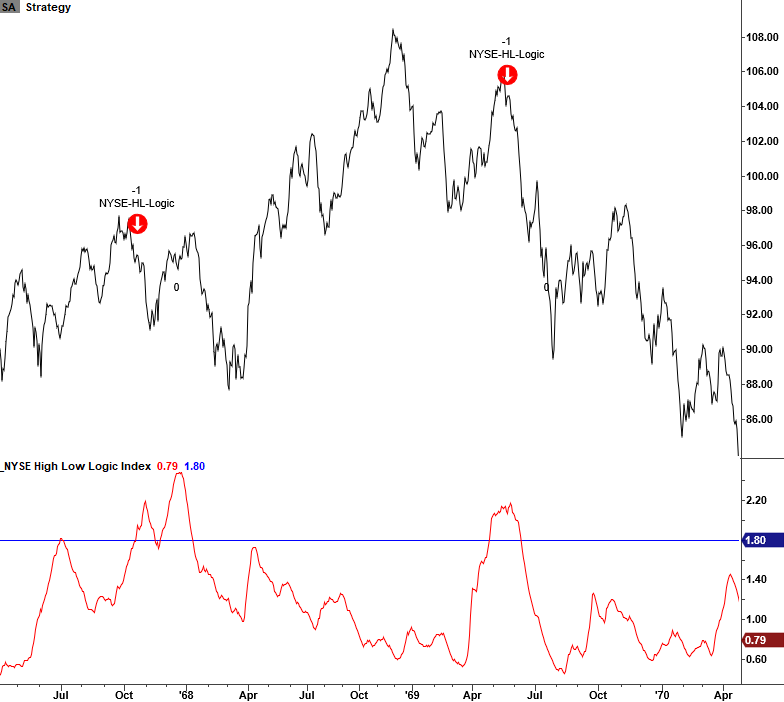
1968-70 Bear Market
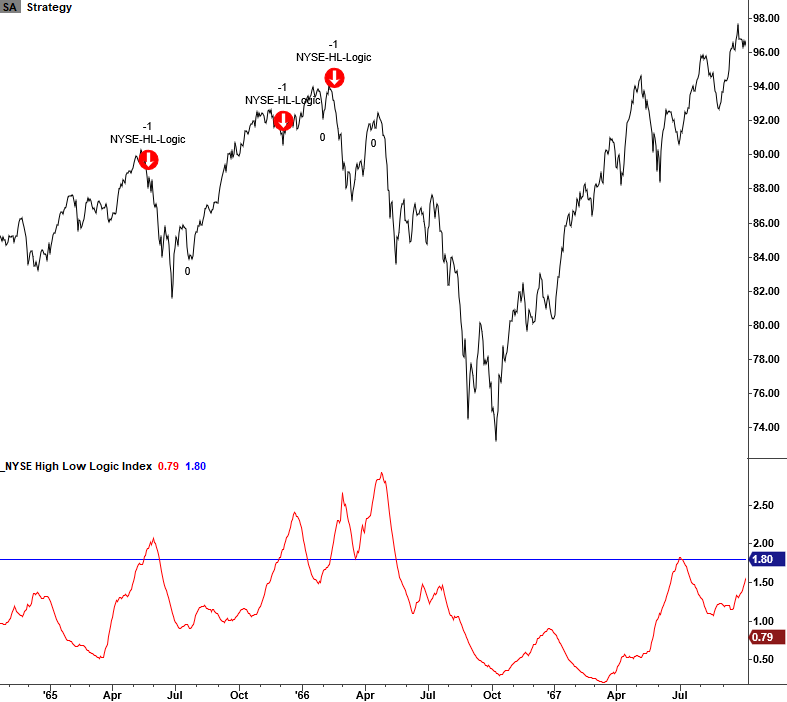
1966 Bear Market
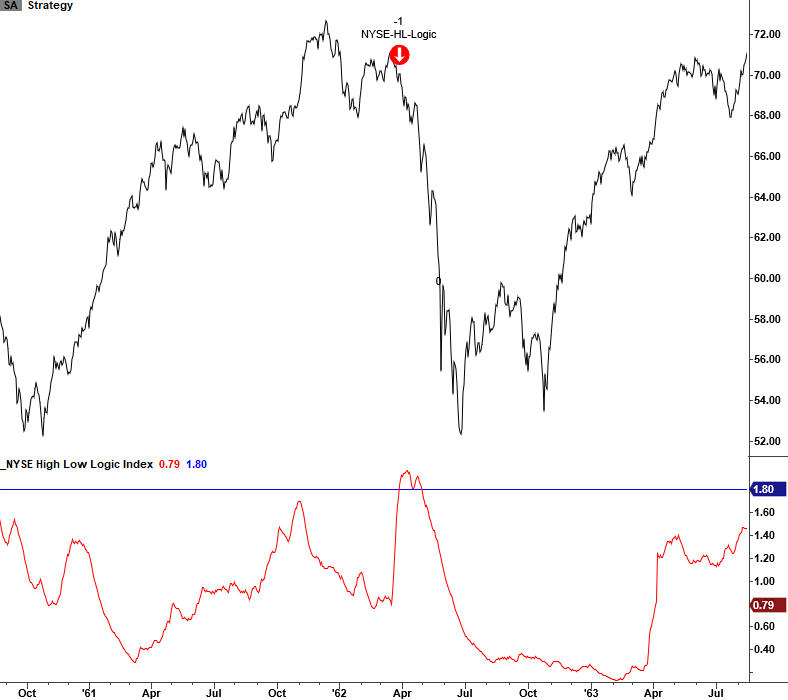
1962 Bear Market
1957-58 Bear Market
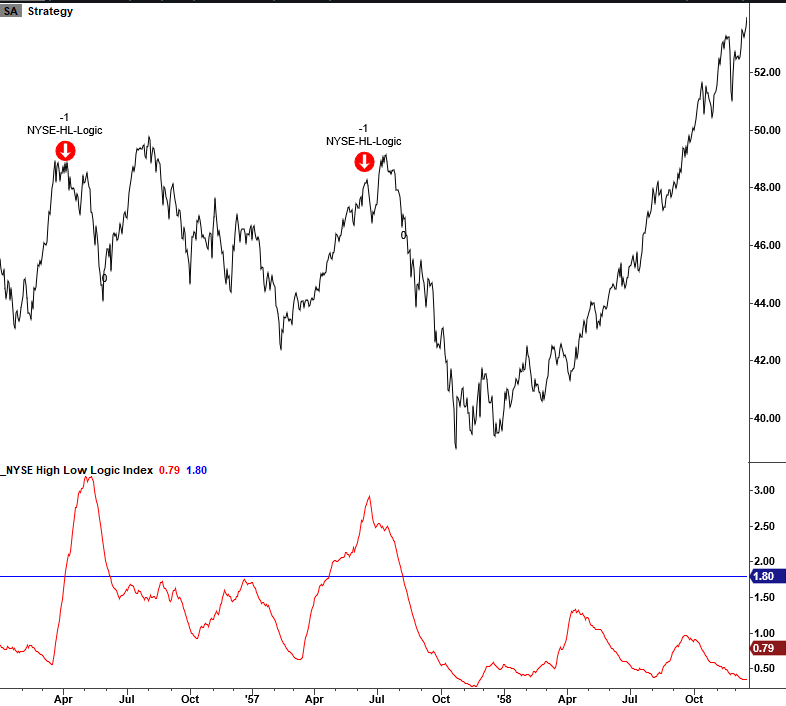
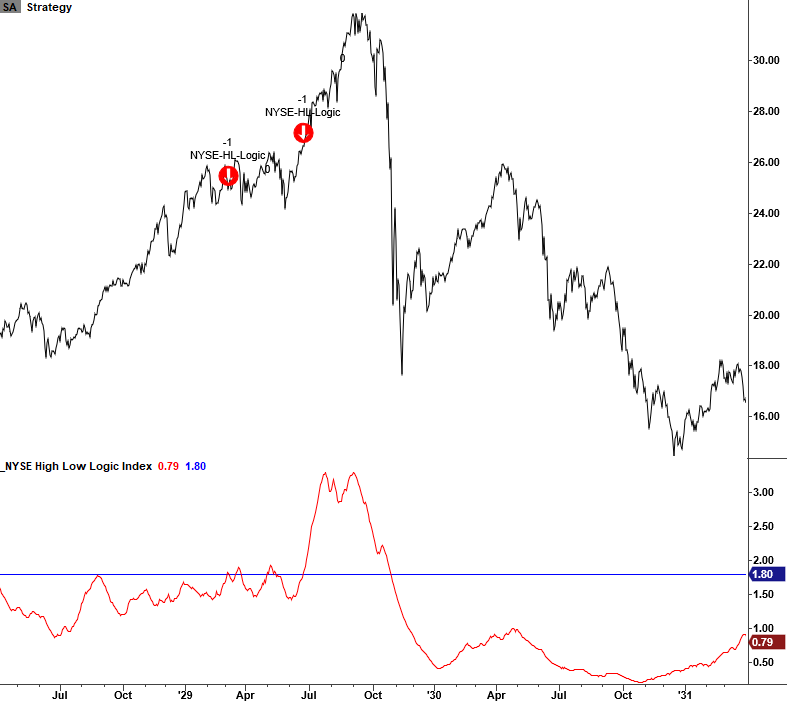
1929-32 Bear Market
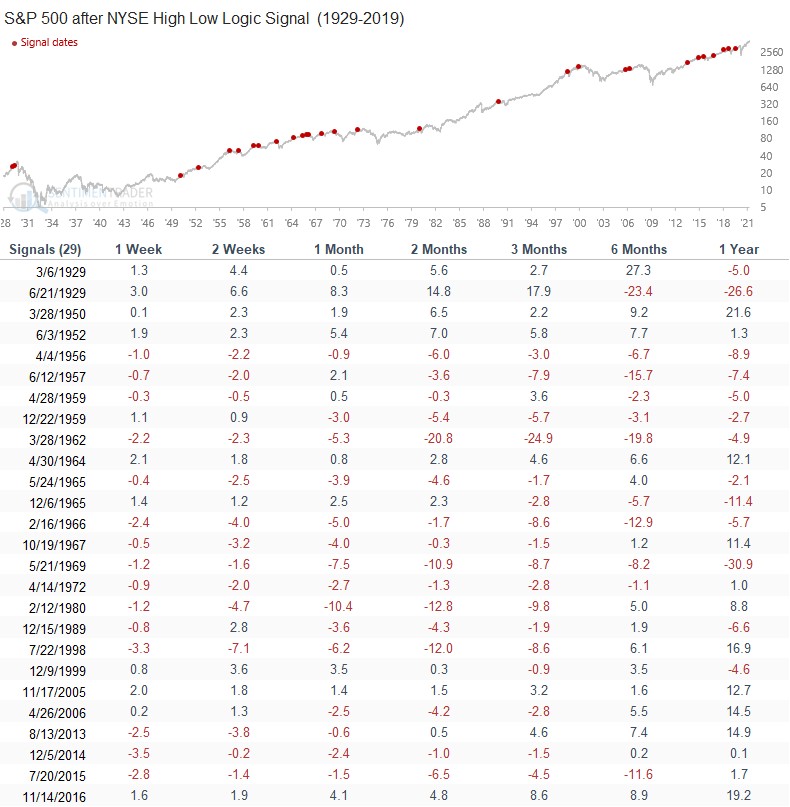
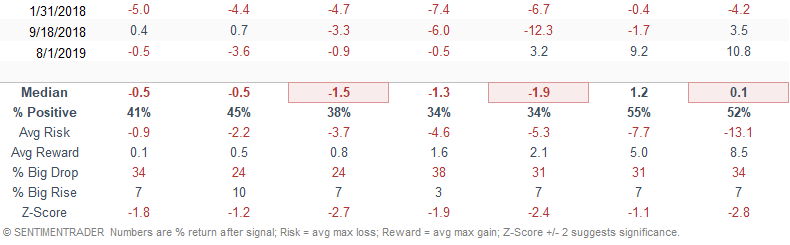
Signal Performance
As one can see, performance is weak across all timeframes with several notable z-scores.
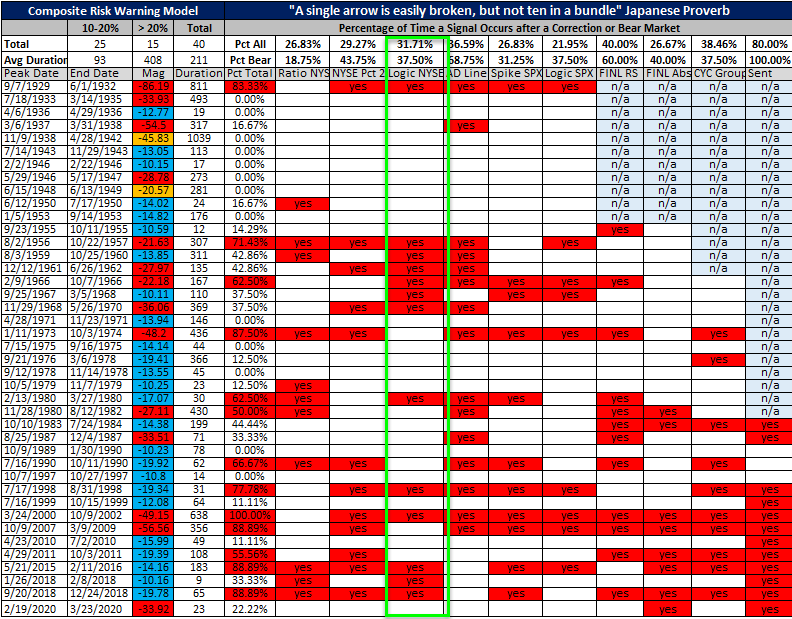
Historical TCTM Risk Warning Model Table
The following table provides a historical signal perspective for components within the TCTM Risk Warning Model. A "yes" in a model column indicates that a signal triggered either before or after a significant correction or bear market peak.
Conclusion: While the NYSE High Low Logic Index recently drifted higher, it remained well below the warning level of 1.8%. With NYSE issues trading significantly above a rolling 52-week low, it's hard to foresee the potential for a new signal in the near term.