
One inflation-related red flag for stocks

Key Points
- The stock market prefers a boring, predictable, and stable economic and inflationary environment
- The stock market outperforms inflation over long periods; however, specific bouts of inflation can hit the stock market hard
- Typically interest rates will rise or fall roughly in line with inflation (during inflationary periods, rates tend to rise as bond investors demand higher yields to compensate for the loss of purchasing power)
- The difference between CPI inflation and 10-year yields is a simple measure worth following
Measuring inflation, rates, and the difference between the two
For this article, we measure inflation, interest rates, and the difference between the two as follows:
- A = 12-month % change in the monthly reported value for the Consumer Price Index (evaluating the most recent reading for CPI as of the close on the last trading day of each month)
- B = Month-end reading for the 10-year treasury yield ($TNX)
- C = (A - B)
In other words, simply subtract the current yield on 10-year treasuries from the 12-month % change in CPI.
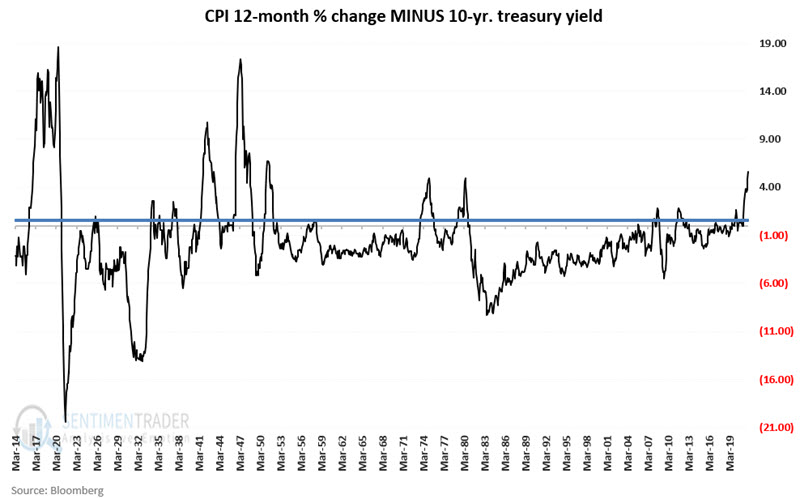
The chart below displays value C above on a month-end basis since 1914. The dark blue horizontal line is drawn at the 0.60 level.
Effect on stocks
For the next part, each month, we compare Value C above to 0.6.
- If Value C is less than 0.6, we deem this bullish for stocks
- If Value C is greater than 0.6, we deem this bearish for stocks
Bearish Readings
The chart below displays the growth of $1 invested in the Dow Jones Industrial Average ONLY during those months when the previous month's Value C was greater than 0.6 (i.e., when inflation is 0.6 points or higher than 10-year treasury yields).
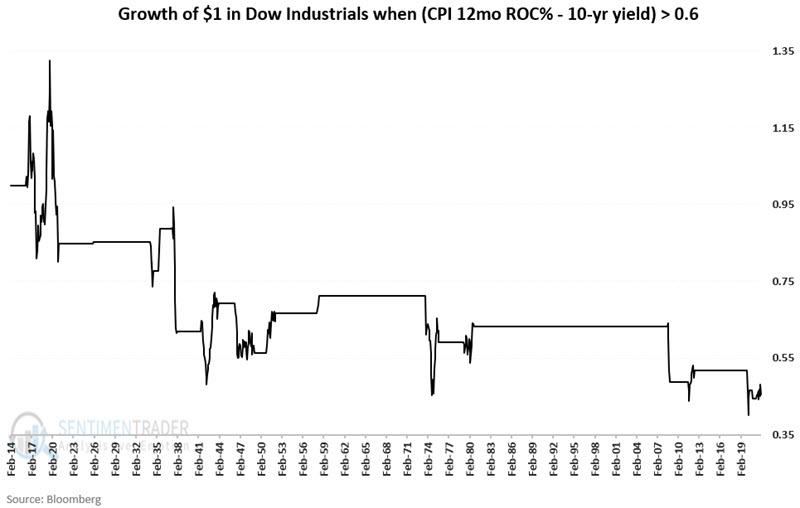
The net result has been a cumulative loss-to-date of -55%.
Bullish Readings
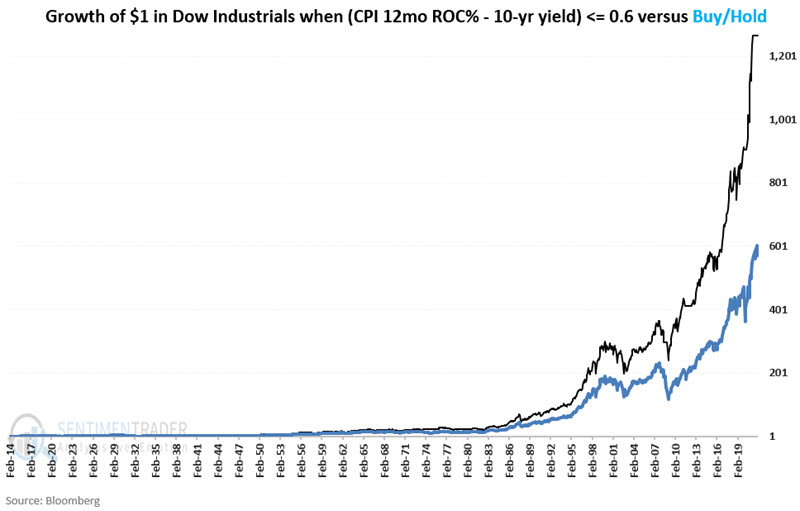
The chart below displays the growth of $1 invested in the Dow Jones Industrial Average ONLY during those months when the previous month's Value C was less than 0.6 (months out of the stock market are assigned a monthly return of 0%).
For reference, the blue line displays the growth of $1 invested in the Dow on a buy-and-hold basis.
The chart below displays the same data as the previous chart but in a logarithmic format to better illustrate the relative performance.
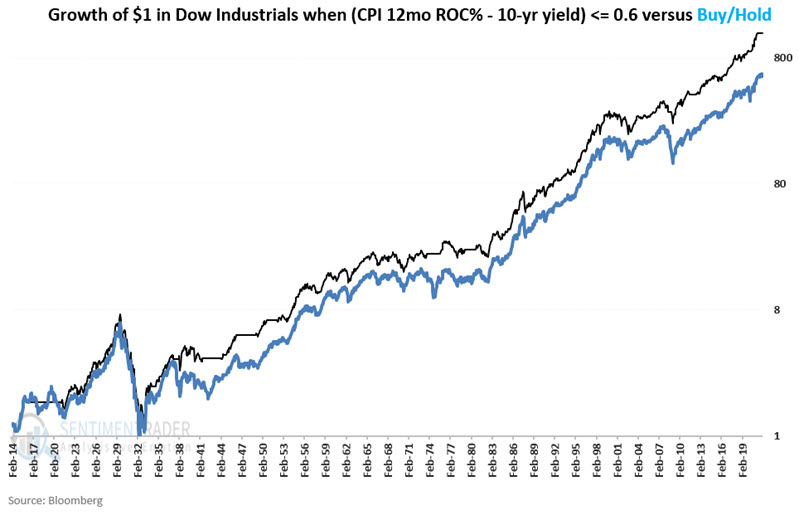
Buying and holding the Dow generated a gain of over +57,000%. Holding the Dow only when Value C is below 0.60 (and assuming no profit or loss during months out of the market) generated a gain over +126,000%.
What the research tells us…
Interest rates tend to move generally in line with inflation. When inflation rises, fixed-income investors typically demand a higher interest rate to compensate for their loss of purchasing power. Conversely, in a declining and/or low inflation period, fixed-income investors will accept a lower interest rate. When this typical tight relationship widens out, it indicates an abnormal state of affairs, which typically - though not always - sees the stock market react poorly.