Data &
Technology
Research
Reports
Report Solutions
Reports Library
Actionable
Strategies
Free
Resources
Simple Backtest Calculator
Simple Seasonality Calculator
The Kelly Criterion Calculator
Sentiment Geo Map
Public Research Reports
Free Webinar
Pricing
Company
About
Meet Our Team
In the News
Testimonials
Client Success Stories
Contact
Log inLoginSign up
< BACK TO ALL REPORTS

Only one other year can truly compare to 2021

Jason Goepfert
2021-12-23
This year has the tightest correlation to 1995 out of any year since 1928. We take a look at all other years with a correlation higher than 0.85. Biotech just gave a sentiment buy signal.

History shows that 1995 is 2021's twin

This year has been a lot like 1995. It has been more like that year than any other, at least in terms of performance. In August, we looked at some of the records being set this year during one of the most persistent and consistent rallies of all time. The one year that was consistent with pretty much all of the momentum studies we've looked at this year is 1995.

That year rallied strongly in September while this year stumbled. Otherwise, they followed each other closely, even including some December weakness.

The S&P 500 in 1995 versus 2021

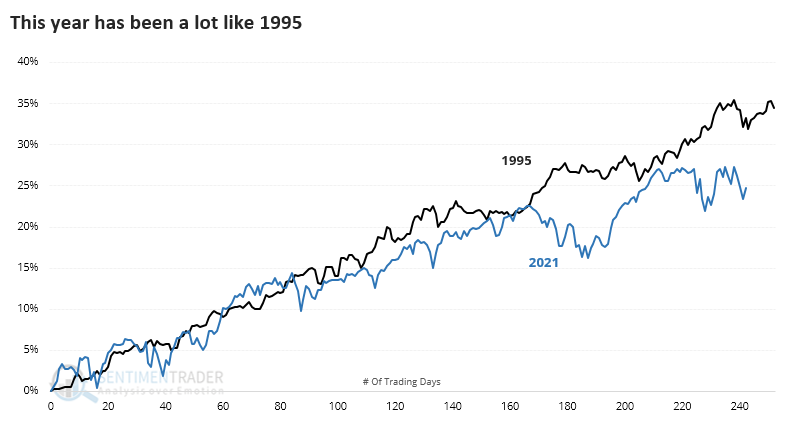
If we go back to 1928 and look at the most highly-correlated years, there have been 18 others with a correlation greater than 0.85 (out of a scale from -1.0 to +1.0). Even with that expanded universe, 1995 still stood out as having the tightest relationship to 2021.

We're most concerned about what these high correlations might mean going forward. Based on those precedents, the answer is positive, at least in the couple of weeks heading into and immediately after the New Year. Over the next 2 weeks, the S&P rallied 15 out of 18 times.

Stat box

Traders have plowed an average of more than $135 million per day over the past 10 days into the XLV Health Care fund. That ranks as the 9th-highest 10-day inflow in the fund's history.


Biotech pessimism is reversing

We have been watching the biotech sector closely of late.

Jay considered the potential for using our Optimism Index (Optix) to play the long side using shares of the SPDR S&P Biotech ETF (XBI). The rule we will use is:

  • The 50-day average for XBI Optix crosses above 40% for the first time in a month

For this signal to occur, the 50-day average for XBI Optix needs to drop below 40%. This typically unfolds over time when XBI experiences a significant decline.

The signals generated by the rule above appear in the chart below, per our Backtest Engine. A new signal occurred after the close on Tuesday 12/21 (denoted by the red dot at the far right of the chart below).

XBI sentiment buy signal

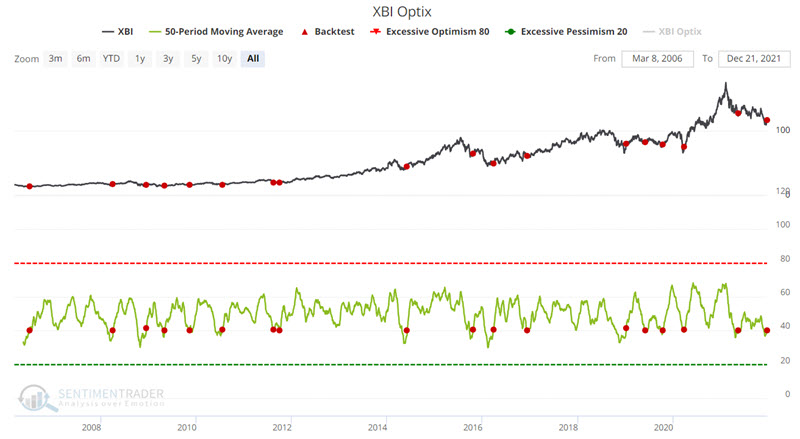
Following the other signals, over the next month, XBI rose 94% of the time, with a median return of +5.6%. Over the next year, it gained a median of 30.9%.

Jay also outlined a couple of ways a trader could take advantage of this setup.

DATA &
TECHnologies
IndicatorEdge
‍
BackTestEdge
‍
Other Tools
‍
DataEdge API
RESEARCH
reports
Research Solution
‍
Reports Library
‍
actionable
Strategies
Trading Strategies
‍
Smart Stock Scanner
‍
FREE
RESOUrCES
Simple Backtest
Calculator
Simple Seasonality
Calculator
The Kelly Criterion
Calculator
Sentiment Geo Map
‍
Public Research Reports
‍
Free Webinar
COMPANY
‍
About
‍
Meet our Team
‍
In the News
‍
Testimonials
‍
Client Success Stories
Pricing
Bundle pricing
‍
Announcements
‍
FAQ
© 2024 Sundial Capital Research Inc. All rights reserved.
Setsail Marketing
TermsPrivacyAffiliate Program
Risk Disclosure: Futures and forex trading contains substantial risk and is not for every investor. An investor could potentially lose all or more than the initial investment. Risk capital is money that can be lost without jeopardizing ones’ financial security or life style. Only risk capital should be used for trading and only those with sufficient risk capital should consider trading. Past performance is not necessarily indicative of future results.

Hypothetical Performance Disclosure: Hypothetical performance results have many inherent limitations, some of which are described below. No representation is being made that any account will or is likely to achieve profits or losses similar to those shown; in fact, there are frequently sharp differences between hypothetical performance results and the actual results subsequently achieved by any particular trading program. One of the limitations of hypothetical performance results is that they are generally prepared with the benefit of hindsight. In addition, hypothetical trading does not involve financial risk, and no hypothetical trading record can completely account for the impact of financial risk of actual trading. for example, the ability to withstand losses or to adhere to a particular trading program in spite of trading losses are material points which can also adversely affect actual trading results. There are numerous other factors related to the markets in general or to the implementation of any specific trading program which cannot be fully accounted for in the preparation of hypothetical performance results and all which can adversely affect trading results.

Testimonial Disclosure: Testimonials appearing on this website may not be representative of other clients or customers and is not a guarantee of future performance or success.