
Opportunity is Where You Find It - The Natural Gas Edition

For the record, an alternative title for this piece might well have been "A Wild-Eyed Speculative Bet Against the Trend in Natural Gas." But - truth be told - I was afraid no one would read it if I called it that.
In this setup piece, I invoked the following:
Jay's Trading Maxim #17: Countertrend trading is perfectly viable - as long as you are willing to be wrong. And then wrong again. Oh, and possibly again, before finally (maybe) being right - assuming of course that you are still taking the trades (HINT: It is doable, but can be even harder than it sounds).
For purposes of this piece, I am also invoking this one:
Jay's Trading Maxim #19: On those occasions when human nature leads you to bet against the prevailing trend, consider a limited dollar risk trade using options.
The bottom line: You want to take a shot, take a shot. But, to achieve any real long-term success, you must:
- Be realistic about your expectations
- Understand that you may have to stop yourself out and later re-enter (possibly several times) before getting the payoff you expect (NOTE: The majority of individuals are not "wired" this way)
- Consider using options to reduce risk and maximize your staying power in the face of an adverse move
Countertrend trading can ONLY be of value to those individuals who eschew any emotional attachment to each given trade AND who are capable of jumping back into the fray quickly if need be.
THE STATE OF NATURAL GAS
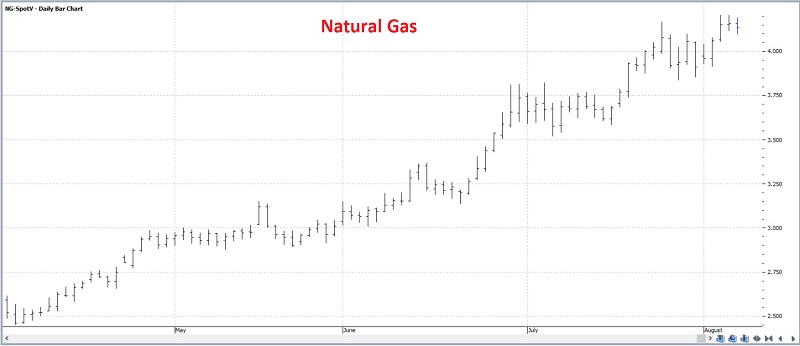
The daily chart below (courtesy of ProfitSource) displays the recent powerful advance enjoyed by natural gas. Looking at this chart along one might wonder why anyone would even consider fading this particular trend.
The monthly chart below, however, puts the recent advance into a slightly different context. Based on historical results, one person might conclude that maybe natural gas will explode higher - but another person might see a strong possibility that the recent advance will run out of steam.
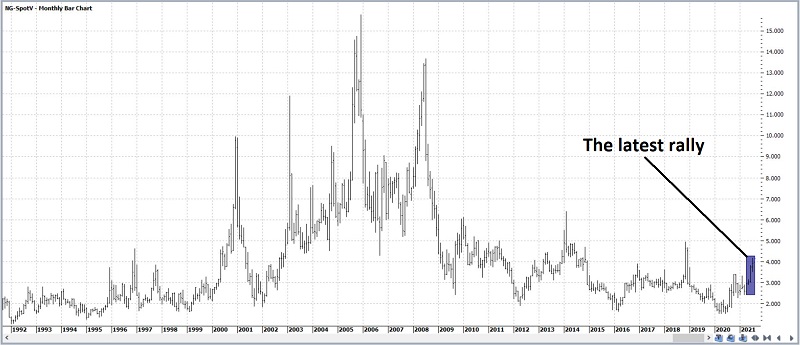
This highlights the primary problem with relying solely on chart patterns to trade - i.e., it is possible to see whatever you want to see in most situations. So, let's consider some other factors.
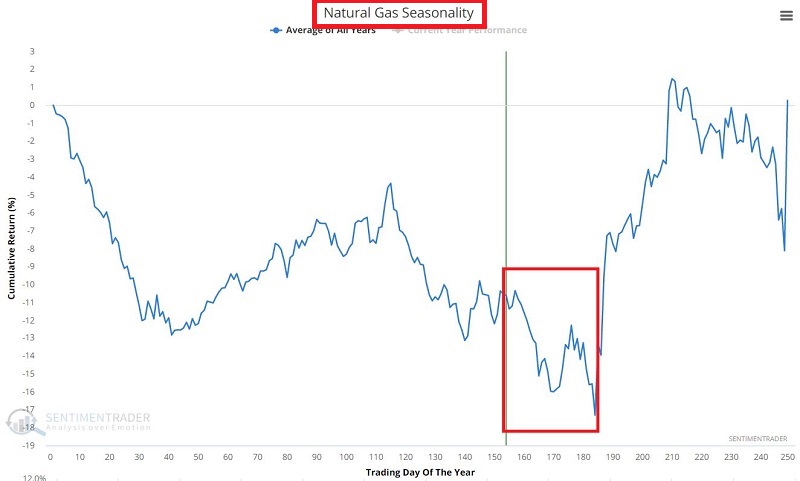
SEASONALITY
The chart below displays the annual seasonal trend for natural gas. As you can see, we are entering a seasonally weak period. This DOES NOT mean that natural gas is doomed to fall. But it does remind us that no rally lasts forever and that if a pullback is due in the current advance, now is a good time to be looking for it.
SENTIMENT
The chart below displays all trading days in the last 20 years when:
- The 5-day average for natural gas Optix
- Was above 65
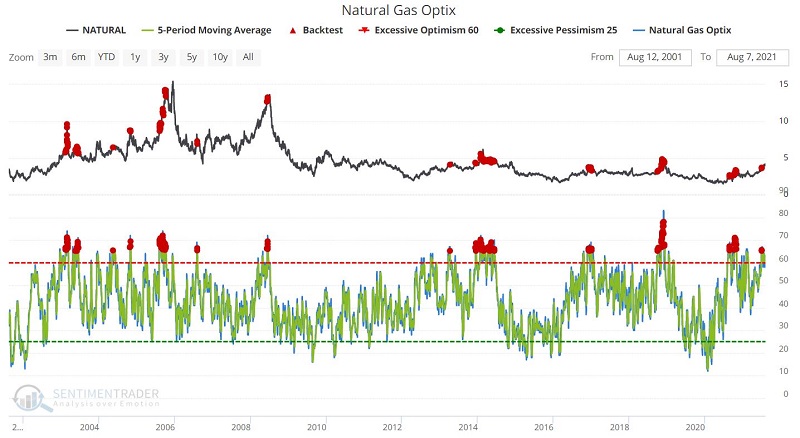
The forward results appear in the table below. Note that results during the first two weeks after such a day were basically a coin-flip. After that, the results got decidedly more unfavorable, particularly 6 and 12 months out.
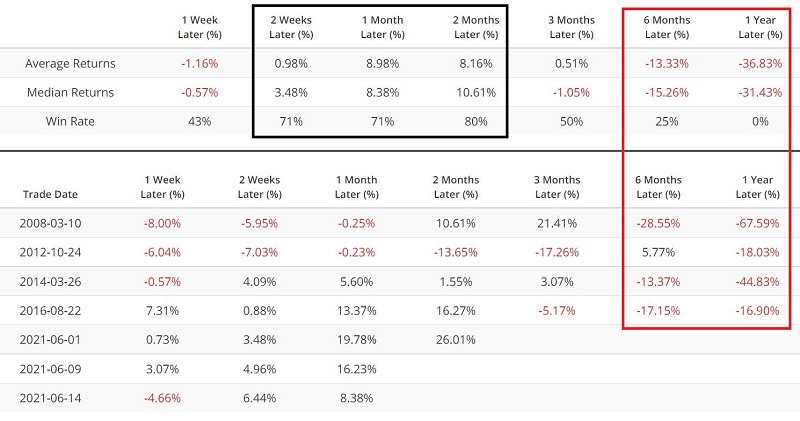
AN INTERMARKET FILTER
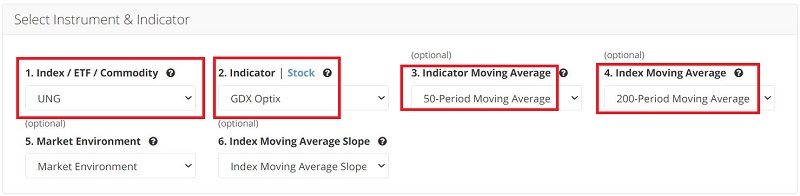
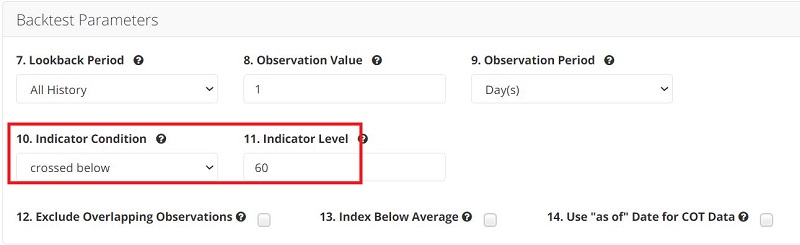
Let's consider an Intermarket filter where we find all trading days when:
- The 50-day average for ticker GDX (VanEck Vectors Gold Miners ETF) Optix crossed below 60
- AND the price for ticker UNG (United States Natural Gas Fund, LP) was above its 200-day moving average
The input screens appear below
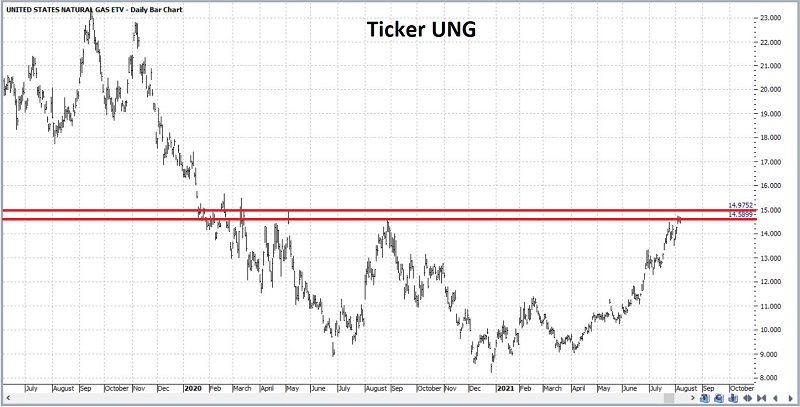
The chart below displays the signal dates for ticker UNG.
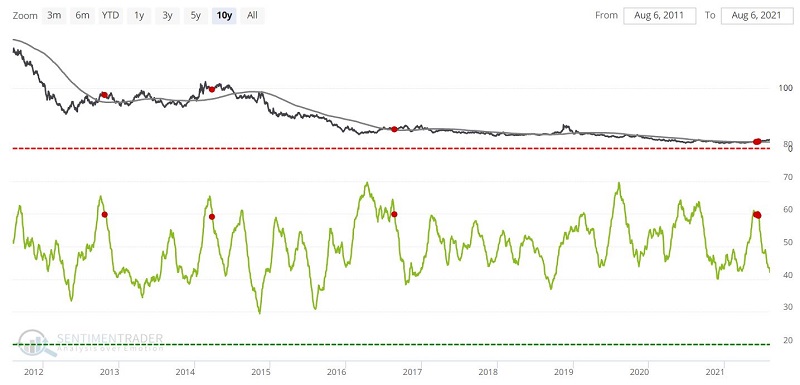
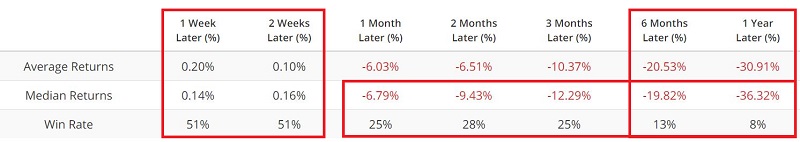
The table below displays the results for ticker UNG following previous signals. It is fair to raise concerns about the small sample size. Nevertheless, note that results were quite favorable during the 2 months after a signal but got progressively more unfavorable after that - particularly 6 and 12 months out.
A CLOSER LOOK AT PRICE
The rally since early April has been quite robust. Still, if we step back and look at the chart below, we can see that on a subjective basis, one can argue that natural gas is running into a natural resistance level.
From a real-world trading point of view, the key here is not to "predict" what will ultimately happen. The key is to recognize the following objective points:
- If price breaks out to the upside above the resistance lines in the chart above, one can argue that the bullish trend is intact, and one should play the long side
- In the meantime, as long as price remains below the resistance lines in the chart above, one can argue that the bullish trend is negated - and that a reversal is possible
PLAYING THE BEARISH SIDE
I am making no predictions about what will or will not happen to the price of natural gas nor ticker UNG. The purpose of the information in this piece is to:
- Highlight a potential situation where a countertrend trade might make sense
- AND highlight why playing that situation with options might also make a great deal of sense
So, let's make the following assumption:
Given all of the factors discussed above, a trader wishes to speculate on the short side of natural gas. The most straightforward play would likely be to sell short natural gas futures contracts. However, not everyone is suited to trade futures contracts as they can entail much leverage and risk.
So instead, we will look at a limited risk option trade example using options on ticker UNG. In this example, our goals are:
- To risk only a limited amount of capital
- To craft a position that will move point-for-point with the underlying shares of UNG as quickly as possible (as opposed to buying a far out-of-the-money put and playing for "the big sell off")
Our example trade involves:
- Buying the UNG Oct15 16 strike price put @ 2.33
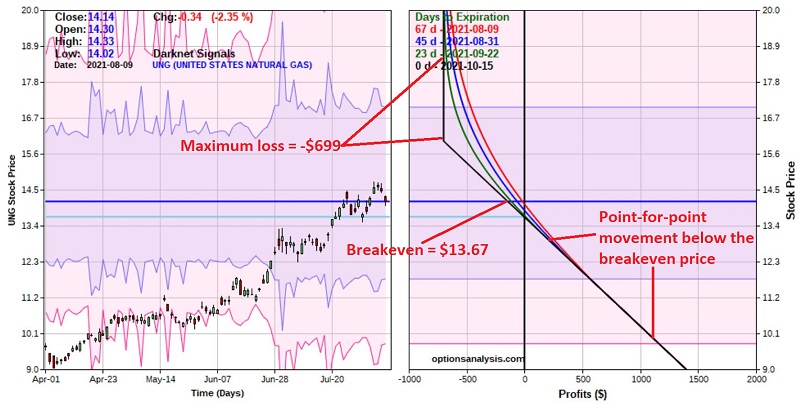
The particulars of this trade appear in the screenshot below, and the risk curves (i.e., the expected profit as of a given date and given price for UNG) appear in the chart below that.
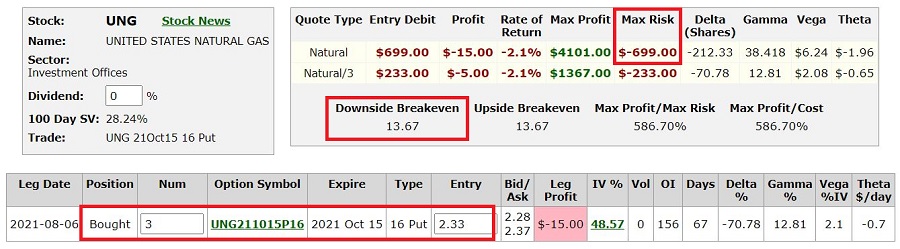
Things to note:
- The cost to enter this trade - and the total risk - is $699
- With UNG trading at $14.14 a share, the breakeven price is $13.67 (i.e., if this trade is held until expiration, it will show a profit if UNG is below $13.67 a share and a loss of UNG is above that price)
- Once UNG drops below the breakeven price of $13.67, the option will move point-for-point with UNG (i.e., if UNG declines $1 in price, the 16 put option will gain $1 in intrinsic value)
As always, the trade above is NOT a "recommendation." The price of UNG might easily continue to advance strongly and turn the example trade into a loser in no time. The trade highlighted above serves merely as just one example of a way to:
- Enter a countertrend trade - even into the teeth of a powerful price advance
- With confidence in knowing that in the very worst case, your risk is limited to a specific amount