
Options speculation in SLV

Key Points
- Silver is in a seasonally favorable period
- Price action is presently not supportive of a bullish position
- Implied volatility for options on SLV is relatively low
The Silver situation
In the chart below (and as I wrote about previously), we see that silver is presently within a seasonally favorable period. Specifically, this favorable period lasts through roughly February 18th.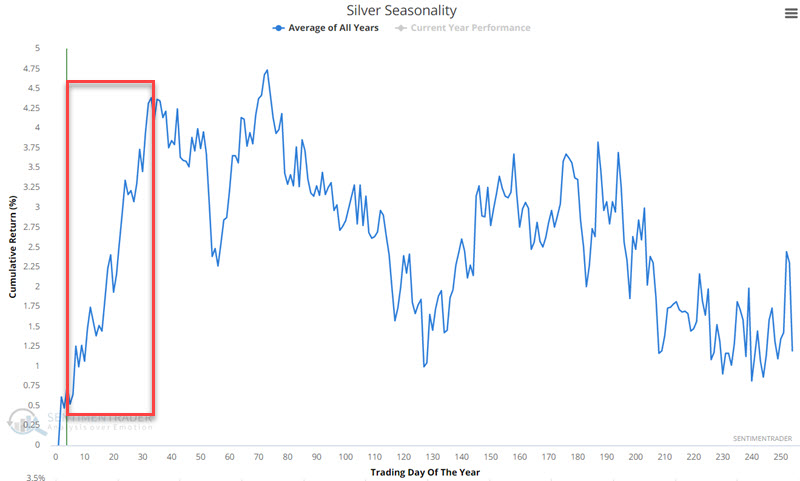
Traders can trade silver much like they would shares of stock using the iShares Silver Trust (SLV) ETF. There are two problems with playing the long side of silver at the moment. The first problem is that the favorable seasonal period highlighted has shown a gain 62% of the time (i.e., it is no "sure thing"). The second problem is that price action for SLV is presently relatively weak - trading below a declining 200-day moving average. There is potential support in the $19.80 a share range on the plus side. The chart below is courtesy of www.StockCharts.com.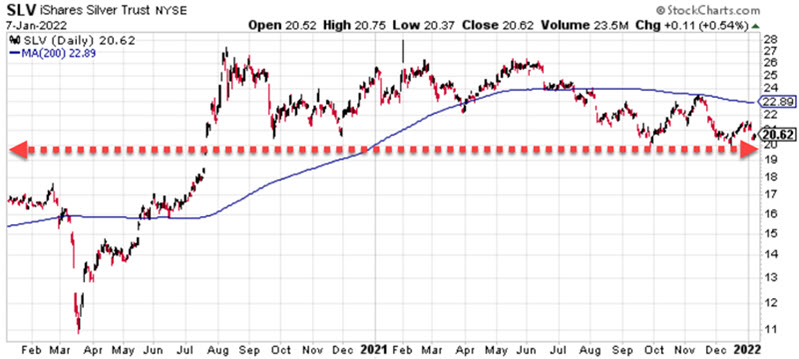
In light of the information above, playing the long side of silver presently constitutes something of a "low probability counter-trend" trade. This approach can be a winning proposition, but it starts with inherent risks. For those who still "want to play," using options on SLV can make a great deal of sense.
The chart below shows that the implied volatility (IV) for options on SLV is presently towards the low end of the historical range. In layman's terms, this means that the amount of time premium built into SLV options is relatively low, i.e., SLV options are "cheap" (remember, the higher the IV, the more time premium built into the options, and the lower the IV, the less time premium built into the options). The chart below reveals that IV for SLV options can "spike" sharply higher from time to time. These spikes in IV result in sharply higher option prices. All charts below are courtesy of www.Optionsanalysis.com.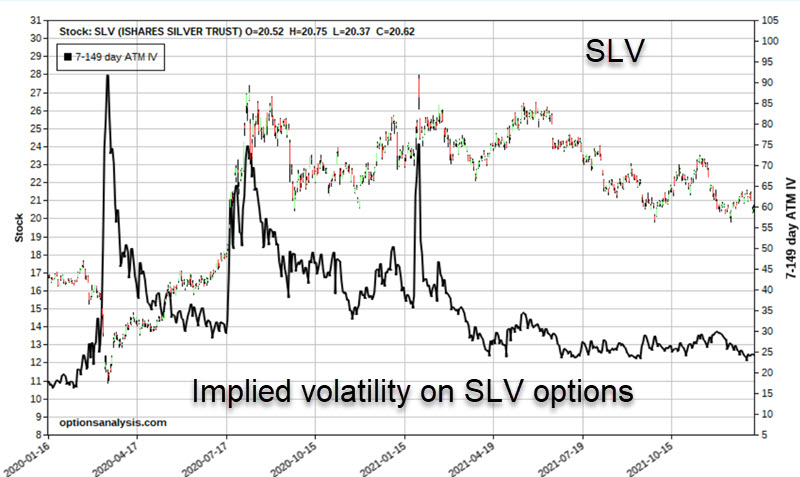
Trading SLV
Consider a trader with a $25,000 account. The most straightforward bullish approach would be to buy 100 shares of SLV for $21.51. The trader could place a stop-loss order below recent support - at, let's say, $19.40 a share. This trade would involve a commitment of $2,151 and an anticipated risk of -$211 (assuming SLV does not gap below the stop-loss price). For each point SLV shares rise or fall, this position will gain or lose $100.
Now let's consider an alternative using options on SLV. The trade we will examine involves a bullish call calendar spread strategy. Let's say our trader recognizes this trade to be highly speculative and decides to commit no more than 1% of their capital - or $250 (a trader wishing to be more aggressive can buy a larger lot-size). Our example trade involves:
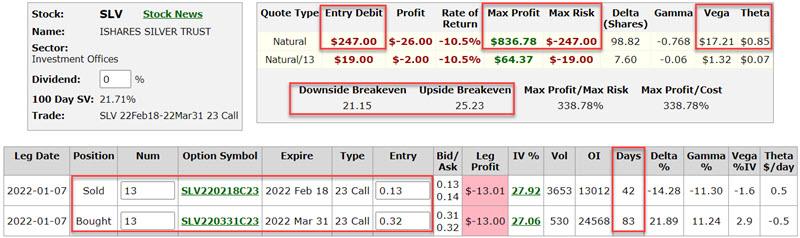
- Buying 13 SLV Mar18 2018 23 calls @ $0.32
- Selling 13 SLV Feb18 2018 23 calls @ $0.13
This trade is presented not as a recommendation but as an example of one way to play the long side of silver without taking on a significant dollar risk. The particulars for this position and the risk curves appear in the charts below.
 Key things to note:
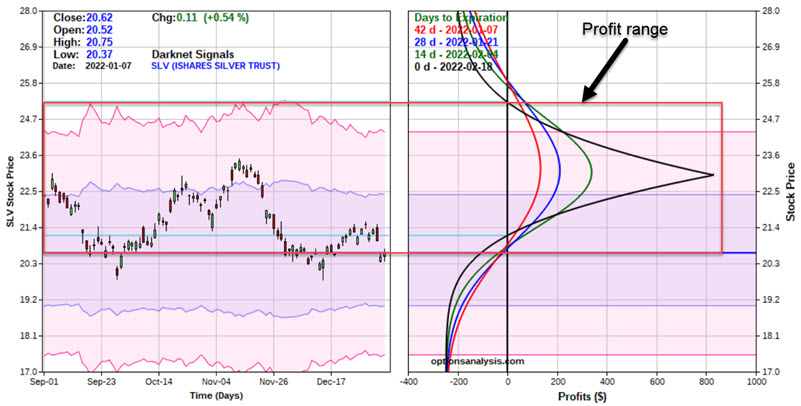
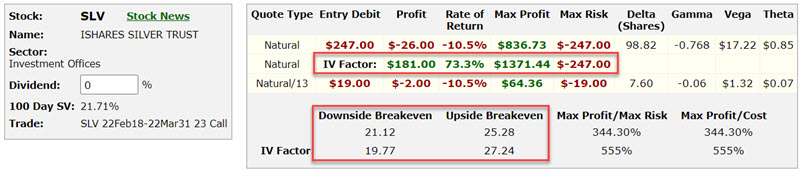
- The total commitment - and maximum risk - for this trade is $247
- This position presently has a "Delta" of roughly 99 - this value can change, but for now, it means the position is roughly equivalent to buying 99 shares of SLV at a fraction of the cost
- This trade has a "profit range." Barring changes in implied volatility, this trade should show a profit as of February options expiration on February 18th if SLV is trading between $21.15 and $25.23. Outside of that range, this trade will show a loss
- This position has a "Vega" of $17.21. This means that if implied volatility rises by one whole percentage point, this position should gain $17.21 in value and vice versa. The trader hopes for a higher IV before Feb. expiration to inflate the value of this position
Managing the option trade
The worst-case for our example options trade is a loss of -$247, so this should not be a "high stress" position. Still, it is essential to have a plan of action in place. The key considerations are "what to do if SLV goes up" and "what to do if SLV goes down."
A mentor of mine taught me to focus on "where this trade really lives." This trade primarily "lives" between just below recent support and $23 a share option strike price. How's that?
The expectation for this trade is that the recent support level of $19.80 for SLV will hold. If it does not, our trader must decide whether to a) cut their loss or b) let it ride. When buying stocks or ETFs, it is typically crucial to cut one's loss if a critical support level is pierced. But remember, for this options trade, the worst thing that can happen is a loss of -$247. So, the decision to "cut bait" or "let it ride" should not be a "high-stress" decision - and comes down to one's personal preference in this case.
On the upside, note in the risk curves chart above that the profit curves begin to "rollover" when the price of SLV exceeds $23 a share. Our trader does not want this to happen (likewise, once SLV moves above $23, our short call is in-the-money and at risk for exercise). So, let's adopt the following trading plan:
- Close the entire position if SLV drops below $19.50 before Feb. expiration (NOTE: $19.50 is arbitrary - any price below support at $19.80 is acceptable)
- Close (or adjust) the position if SLV approaches $23 a share
The risk curves chart below more clearly illustrates the expected reward and risk for this position "where this trade lives," between $19.50 and $23.00.
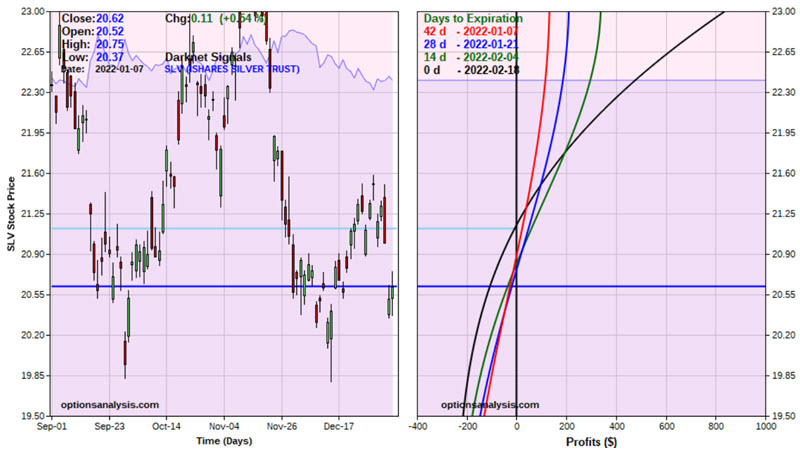
Time is a crucial component of this position. If $19.50 is hit immediately, the trade will lose roughly -$130. If $19.50 is hit at Feb. expiration, the trade will lose approximately -$210.
On the upside, if $23 is hit immediately, the trade will gain roughly $130. If $23 is hit at Feb. expiration, the trade will gain approximately $830.
The impact of changes in implied volatility
I noted earlier that our example options position has a positive "Vega." Let's consider the potential effect of a significant IV "spike" on this position. Let's assume that based on some news or some sharp movement in price, that IV rises 50% from current levels (which we saw in the earlier IV chart is a possibility with SLV).
The chart below notes that the "expected" change in profit potential for this trade - based solely on the increase in IV - is $181. Note also that the "profit range" expands from $21.12 to $25.28 initially, to $19.77 to $27.24 after the increase in volatility. In essence, an increase in IV during the life of the trade would shift the risk curves to higher ground, expanding the profit range and the overall profit potential.
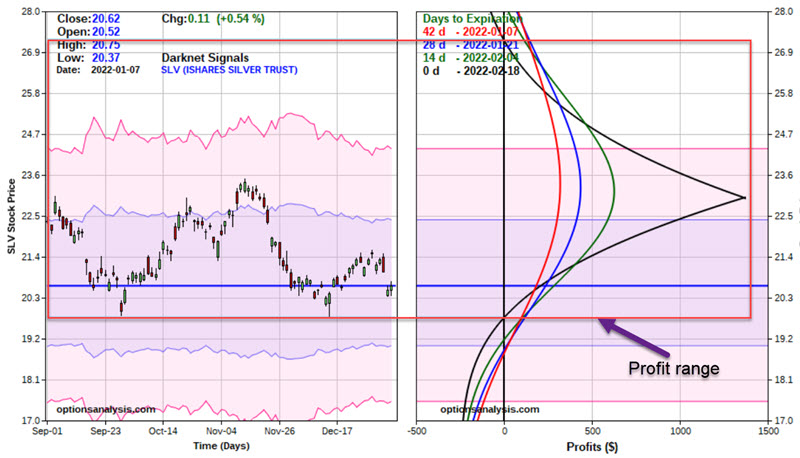
If IV were to rise 50%, if $23 is hit immediately, the trade will gain roughly $310. If $23 is hit at Feb. expiration, the trade will gain approximately $1,370.
The bad news is that implied volatility could just as easily decline instead, which would reduce the probability of profit on this trade. Nevertheless, the maximum risk is still $-247.
What the research tells us…
A calendar spread can offer a low-dollar risk way to gain exposure in a situation where you might typically stand aside. Likewise, this strategy can provide a low dollar commitment, substantial upside potential, and a way to take advantage of an increase in volatility. These lessons are the real point of this piece regardless of how the example SLV trade ultimately plays out.