
Options volume suggests higher stock prices

Key points:
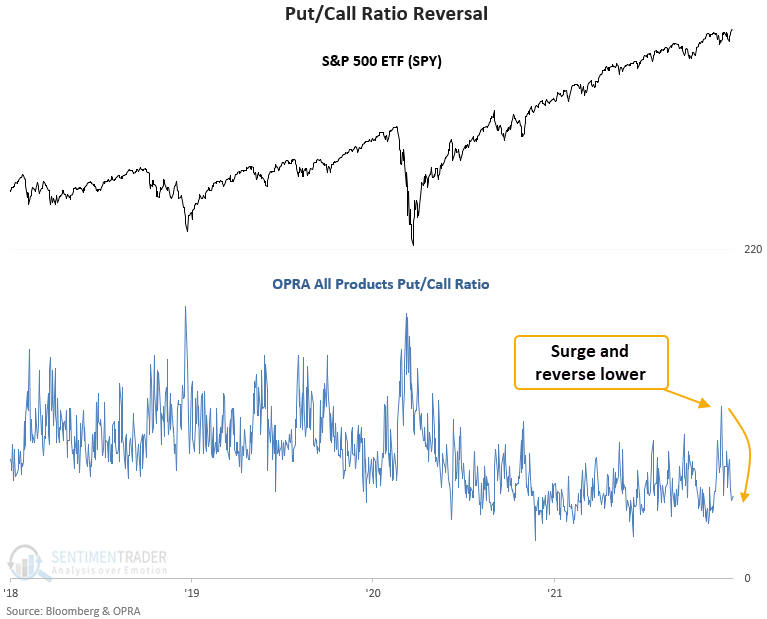
- OPRA all products put volume increased relative to call volume
- The put/call ratio has now reversed lower from an elevated level
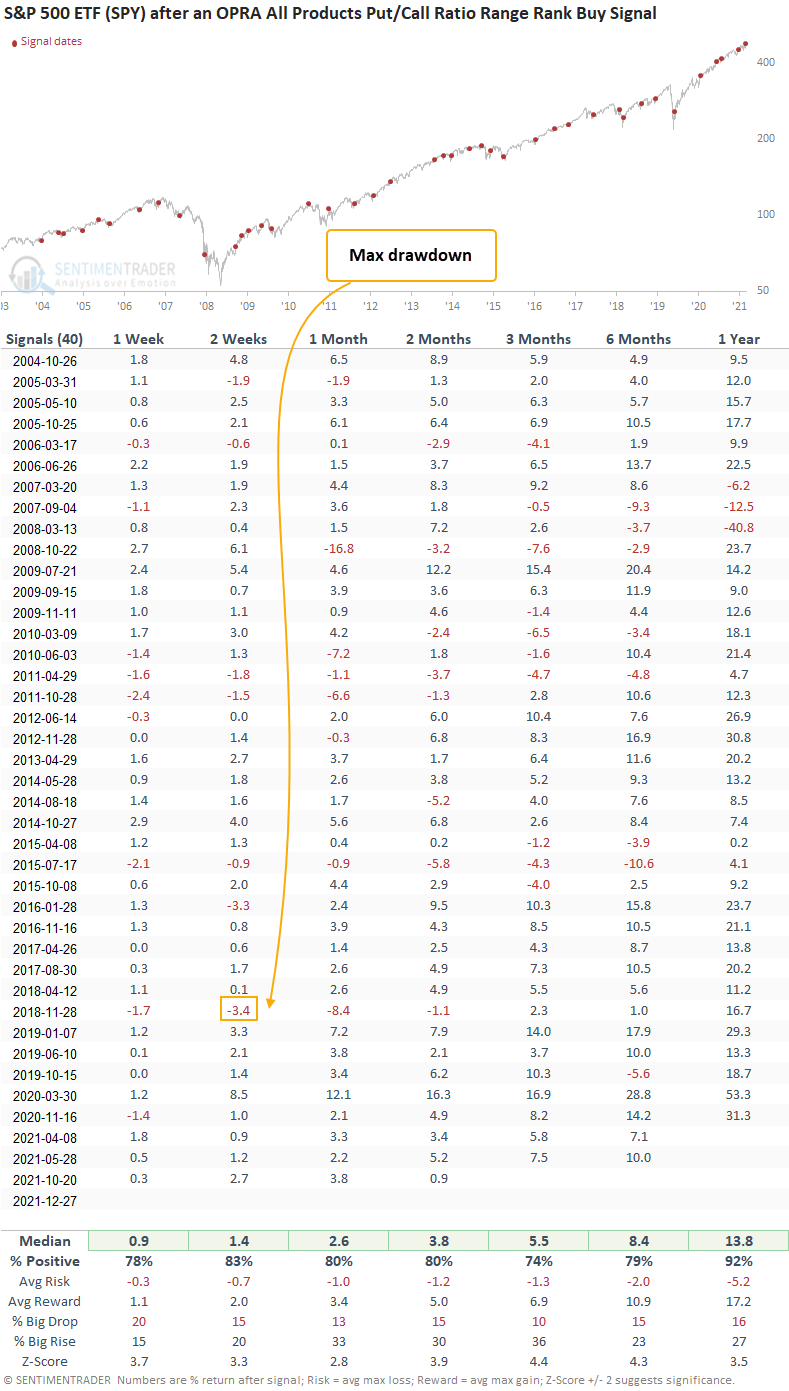
- The S&P 500 has rallied 83% of the time over the next two weeks after other signals
The put-call ratio as a contrary sentiment indicator
When investors are bullish on stocks, they buy call options to bet on rising prices. Conversely, when they are bearish on stocks, they buy put options to bet on declining stocks. The Total U.S. Put/Call Option Volume Ratio can be used as a contrary indicator to identify an environment where sentiment has become too pessimistic on the future direction of stocks. When opinions become too bearish, stocks tend to rally.
The Options Price Reporting Authority (OPRA) aggregates options data from a consortium of exchanges.
A trading model that identifies a reversal in the put/call ratio
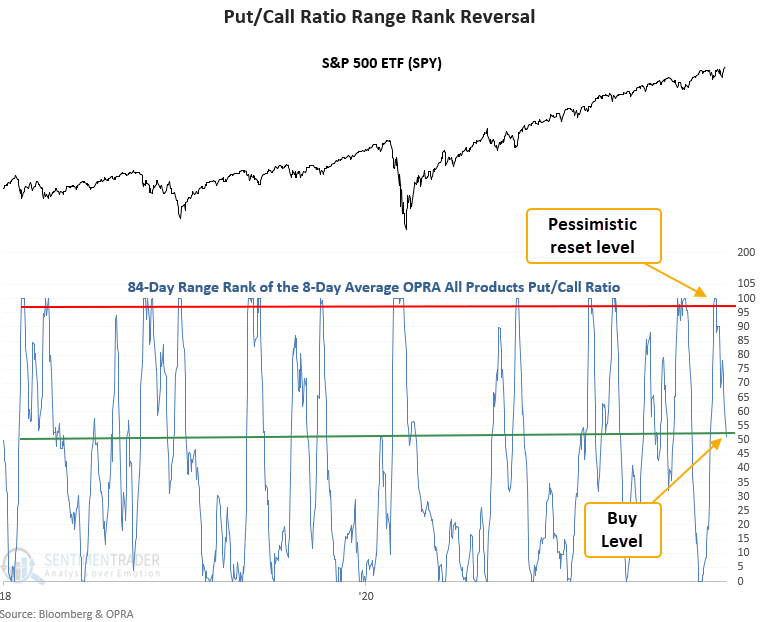
I apply two derivative indicators to the OPRA all products put/call ratio because the series is volatile and I need to identify an extreme level that may shift through time. The first is a moving average to smooth the erratic nature of the series. The second is a range rank that I apply to the average put/call ratio. The range rank indicator allows me to identify threshold levels for trading signals. As a reminder, the range rank measures the current value relative to all other values over a lookback period. 100 is the highest, and 0 is the lowest.
The put/call ratio trading model applies an 84-day lookback period to an 8-day average of the OPRA all products put/call ratio. The pessimistic reset condition is confirmed when the range rank indicator crosses above the 99th percentile. A new buy signal occurs when the range rank crosses back below the 53rd percentile. At the same time, the 5-day rate of change for the SPY ETF must be >= 0%. i.e., market momentum is positive.
Similar reversals in the put/call ratio have preceded gains 83% of the time
This signal triggered 40 other times over the past 18 years. After the others, future returns, win rates, and risk/reward profiles were excellent across all time frames, especially the 2-week window. And, the 2-week window shows a max drawdown of 3.4%.
What the research tells us...
When OPRA all products put volume increases relative to call volume, traders have become too pessimistic on the outlook for stocks. Stocks are likely to trade higher when the pessimistic extreme reverses. Similar setups to what we're seeing now have preceded rising prices for the S&P 500 ETF (SPY), with a 2-week win rate of 83%.