Products
SentimenTrader Trading Tools
‍
Backtest Engine
My Trading Toolkit
Correlation Analysis
Seasonality
Indicators & Data API
‍
Proprietary Indicators & Charts
Market Data API
Strategies & Scanner
‍
50+ Trading Strategies
Smart Stock Scanner
Research Reports
‍
Research Solutions
Reports Library
Free Resources
Simple Backtest Calculator
Simple Seasonality Calculator
The Kelly Criterion Calculator
Sentiment Geo Map
Public Research Reports
Education
Sentiment Indicators
Technical Indicators
Pricing
Company
About
In the News
Testimonials
Client Success Stories
Contact
Log inLoginSign up
< BACK TO ALL REPORTS

Penny stocks see another surge

Jason Goepfert
2021-03-10
Through February, traders continued to pour into the most speculative corners of the market, including over-the-counter, or penny, stocks. Volume there is the highest in over a decade.

Over the past couple of months, we've been raising the alarm on several pockets of speculative activity, which had reached or exceeded all prior records.

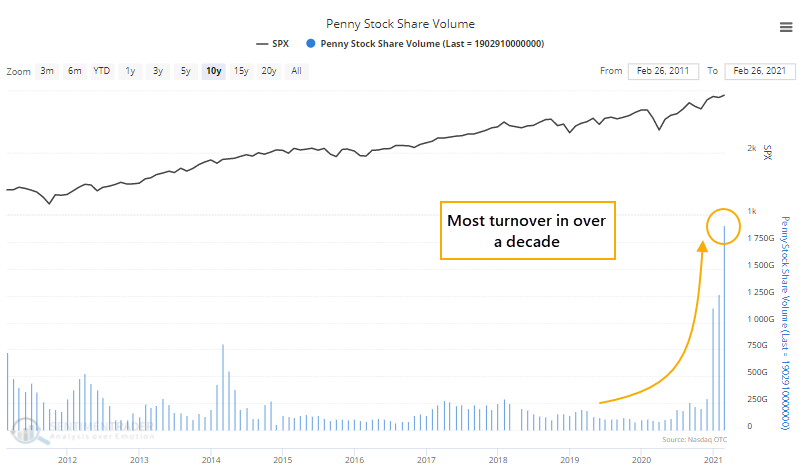
Bullish options trading, IPO and add-on volume, and penny stock trading were among the most egregious examples. With the latter, it's only getting more extreme.

The latest figures are out, covering activity through the end of February, and it shows an increasing willingness to trade the riskiest securities available to individual investors.

The number of shares traded has jumped to nearly 2 trillion shares (yes, trillion).

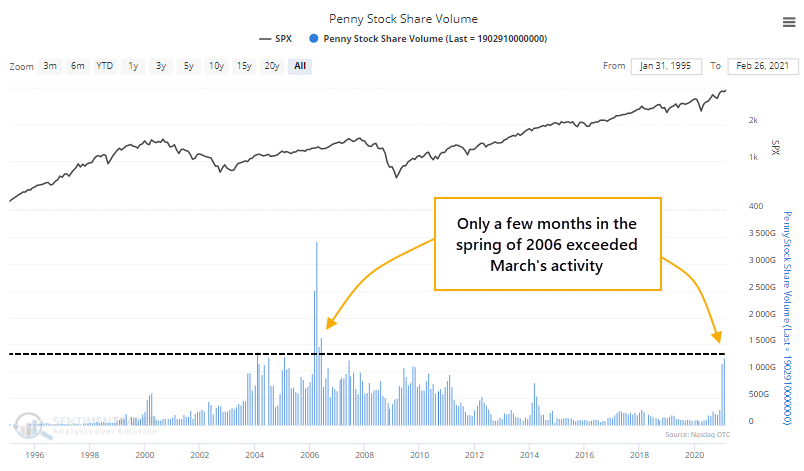
Zooming out further, we can see that only a few months in early 2006 exceeded this pace of activity.

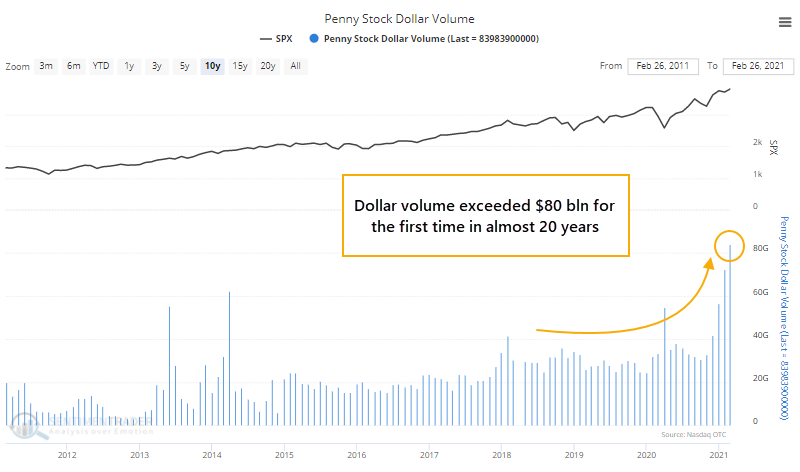
The dollar volume traded rose to nearly $84 billion, again the highest in the past decade.

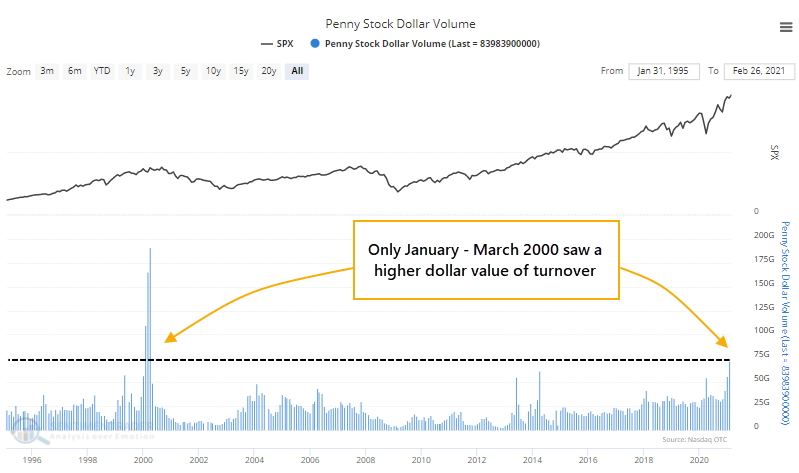
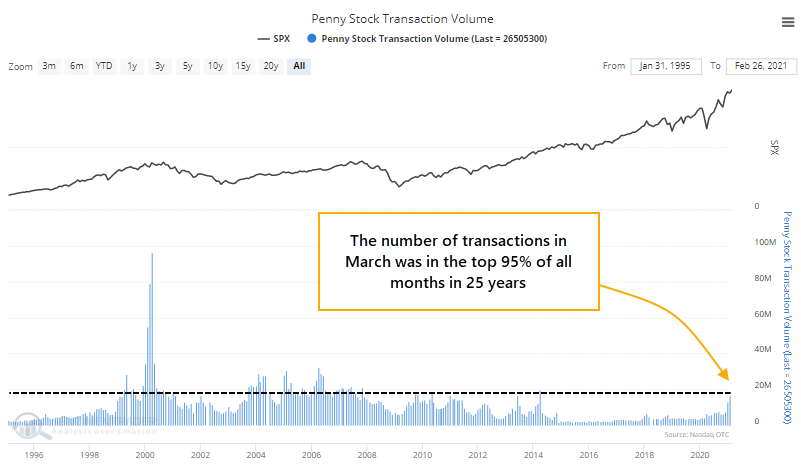
Going back nearly 30 years, February's activity was only exceeded by January - March of 2000.

It wasn't just a handful of large trades accounting for this volume, either. The number of transactions exceeded 26 million, again the most in a decade.

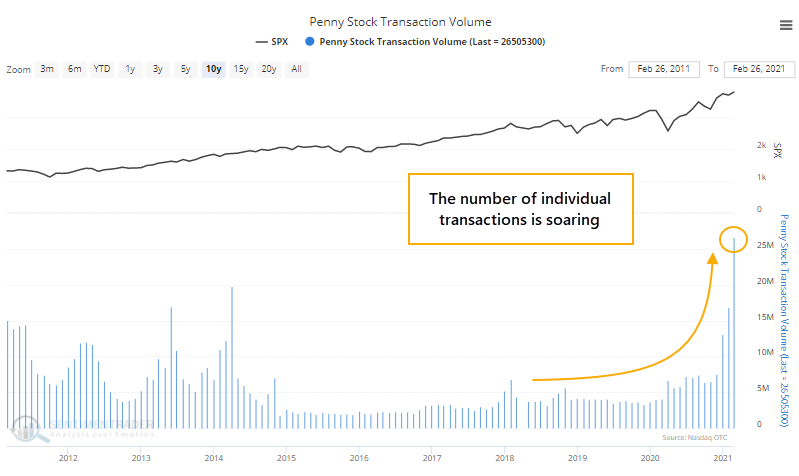
There have been several periods where there were more transactions, so not quite as extreme as the other two measures.

Like the "split" market conditions we've looked at a few different ways recently, part of this activity is influenced by a small corner of the market. Trading in a single stock, Healthier Choices Management Corp, accounted for a big part of February's over-the-counter activity. But as with other indicators, we've never had success trying to outguess whether the indicators matter or not. For a time, these figures were skewed by trading in Fannie and Freddie shares. We didn't arbitrarily adjust for that then, and won't now.

Taken altogether, while there might be some minor caveats, we'd consider this surge in turnover in the most speculative corner of the market to be a long-term negative.

Sorry, you don't have access to this report

Upgrade your subscription plan to get access
Go to Dasboard
PRODUCTS
SentimenTrader
Trading Tools
Indicators & Data API
‍
Strategies & Scanner
‍
Research Reports
FREE
RESOUrCES
Simple Backtest
Calculator
Simple Seasonality
Calculator
The Kelly Criterion
Calculator
Sentiment Geo Map
‍
Public Research Reports
‍
Education
Sentiment Indicators
‍
Technical Indicators
‍
Pricing
Bundle pricing
‍
FAQ
‍
Announcements
‍
COMPANY
‍
About
‍
In the News
‍
Testimonials
‍
Client Success Stories
CONTACT
‍
General Inquiries
‍
Media Inquiries
‍
Financial Professionals Inquiries
‍
© 2025 Sundial Capital Research Inc. All rights reserved.
Setsail Marketing
TermsPrivacyAffiliate Program
Risk Disclosure: Futures and forex trading contains substantial risk and is not for every investor. An investor could potentially lose all or more than the initial investment. Risk capital is money that can be lost without jeopardizing ones’ financial security or life style. Only risk capital should be used for trading and only those with sufficient risk capital should consider trading. Past performance is not necessarily indicative of future results.

Hypothetical Performance Disclosure: Hypothetical performance results have many inherent limitations, some of which are described below. No representation is being made that any account will or is likely to achieve profits or losses similar to those shown; in fact, there are frequently sharp differences between hypothetical performance results and the actual results subsequently achieved by any particular trading program. One of the limitations of hypothetical performance results is that they are generally prepared with the benefit of hindsight. In addition, hypothetical trading does not involve financial risk, and no hypothetical trading record can completely account for the impact of financial risk of actual trading. for example, the ability to withstand losses or to adhere to a particular trading program in spite of trading losses are material points which can also adversely affect actual trading results. There are numerous other factors related to the markets in general or to the implementation of any specific trading program which cannot be fully accounted for in the preparation of hypothetical performance results and all which can adversely affect trading results.

Testimonial Disclosure: Testimonials appearing on this website may not be representative of other clients or customers and is not a guarantee of future performance or success.