
Percentage of members above the 10-day moving average buy signal concept

In a note on 3/24/21 and 3/19/21, I highlighted the short-term oversold condition in an uptrend for Financials and Energy. The sectors had greater than 90% of members trading above their respective 200-day moving average and less than 10% above their 10-day average. The risk/reward profile looked good for both groups as a standalone signal. However, when I identify oversold conditions in an uptrend, I like to see confirmation that the negative momentum is abating by waiting for an upside reversal. In anticipation of potential reversal signals for financials and energy, I want to share the concept behind a momentum thrust model that utilizes the percentage of members above the 10-day moving average. For today's study, I will use S&P 500 members so we can see more historical signals.
Percentage of Members above the 10-Day Average Oversold to Overbought Buy Signal
The percentage of members above the 10-day average seeks to identify instances in history when the number of members trading above their respective 10-day moving average cycles from oversold to overbought in a user-defined number of days or less. The model will issue an alert based upon the following conditions.
Signal Criteria for S&P 500 Members
Condition1 = Percentage of members cross below 11.75%.
Condition2 = Percentage of members cross above 87%.
Condition3 = If Condition1 and 2, start days since true count.
Condition4 = If Days since true count <= 9, then buy.
Let's take a look at some charts and the historical signal performance.
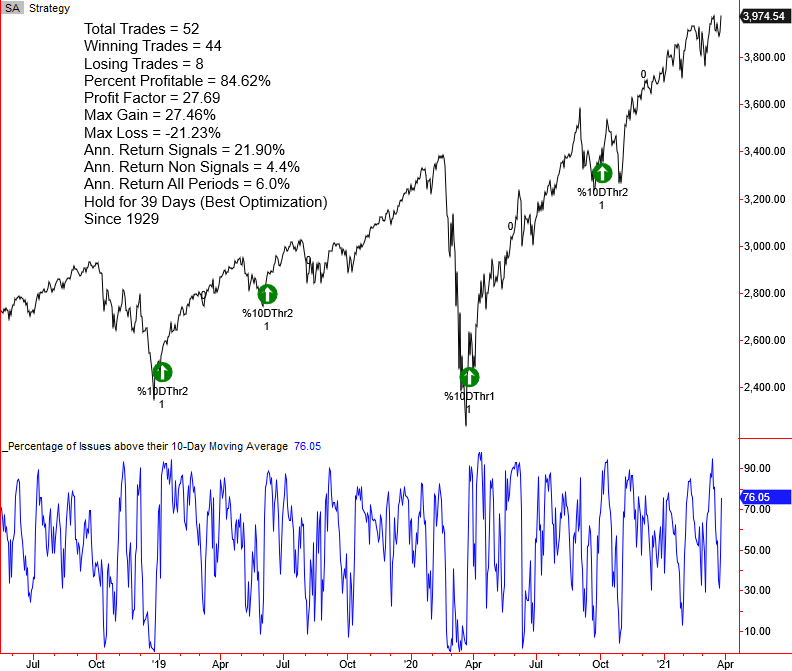
Current Day Chart Example
The most notable trading statistic in the chart below is the profit factor, with a $27 gain for every $1 loss.
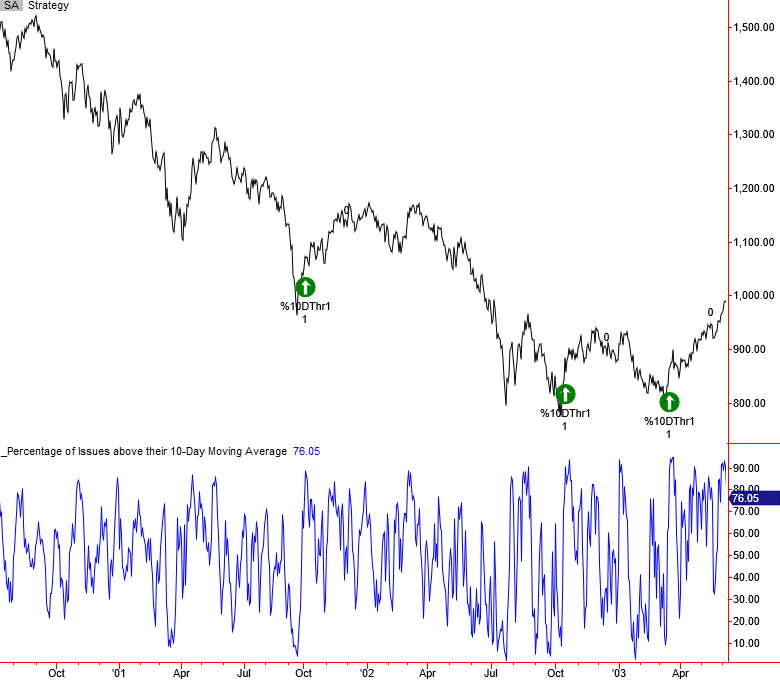
2000-02 Chart Example
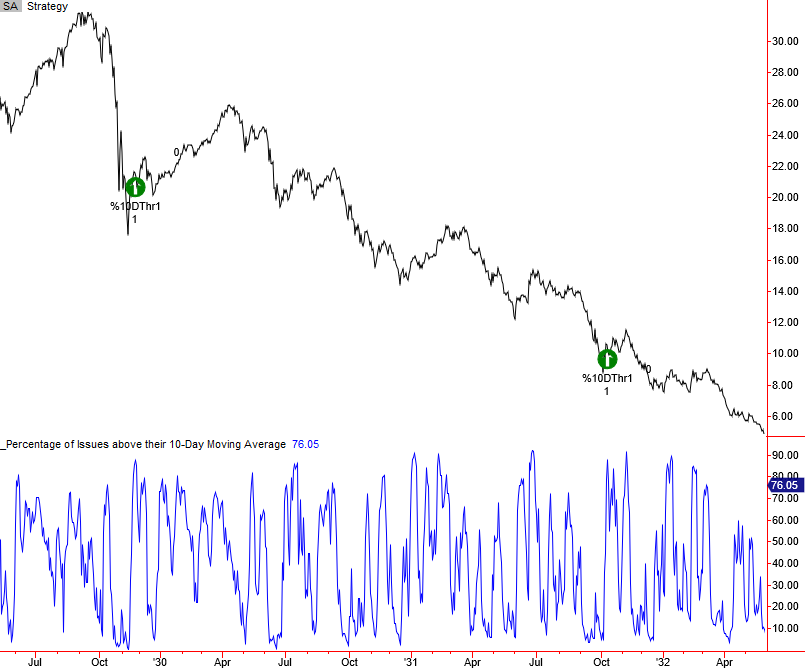
1929-32 Chart Example
I always like to see how breadth signals perform during the 1929-32 bear market. While the signals did not coincide with the bear market low, they both identified a tradeable bounce that generated a profit in the first four weeks.
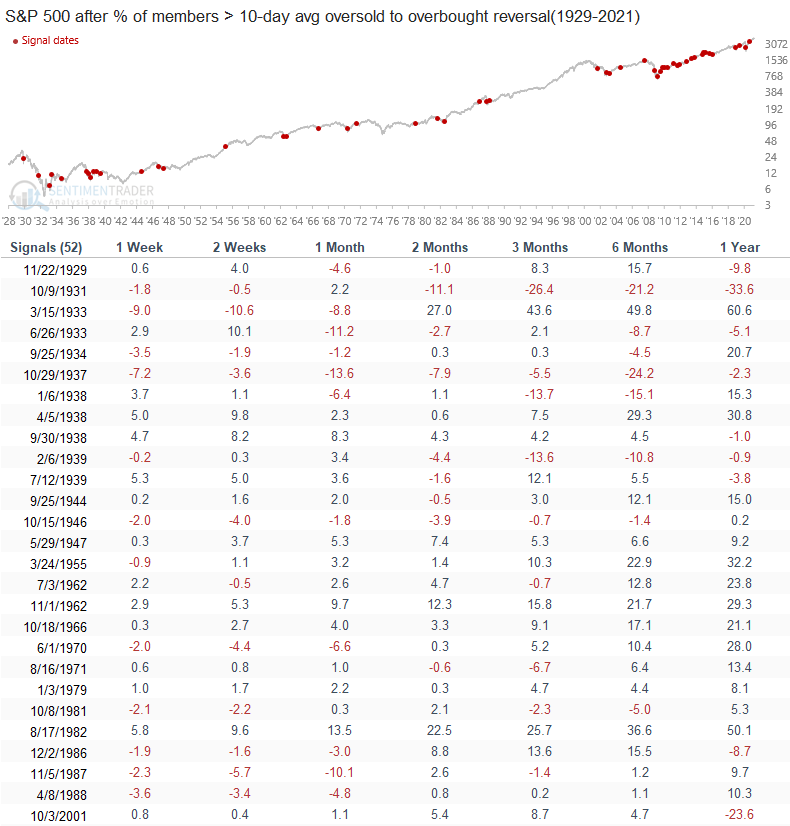
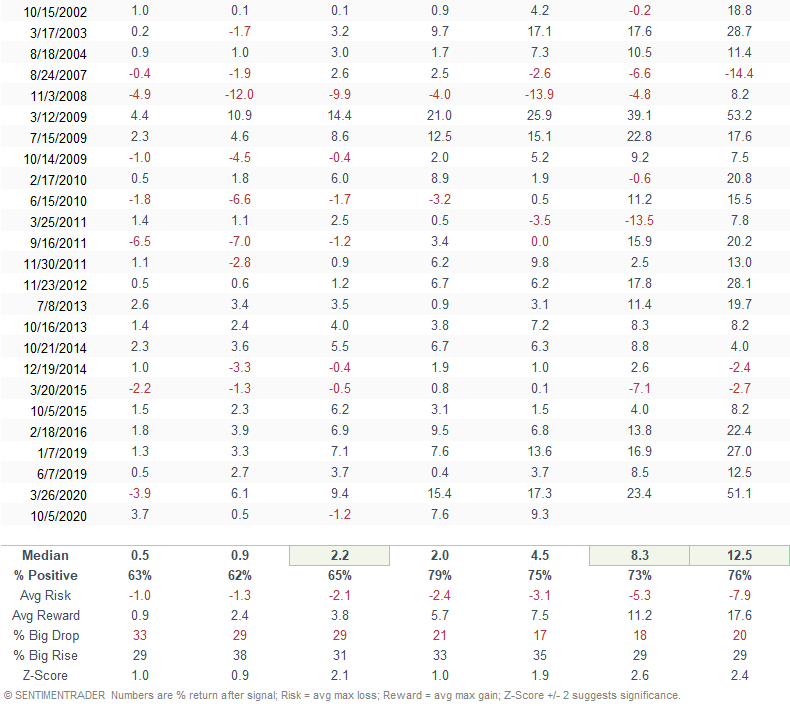
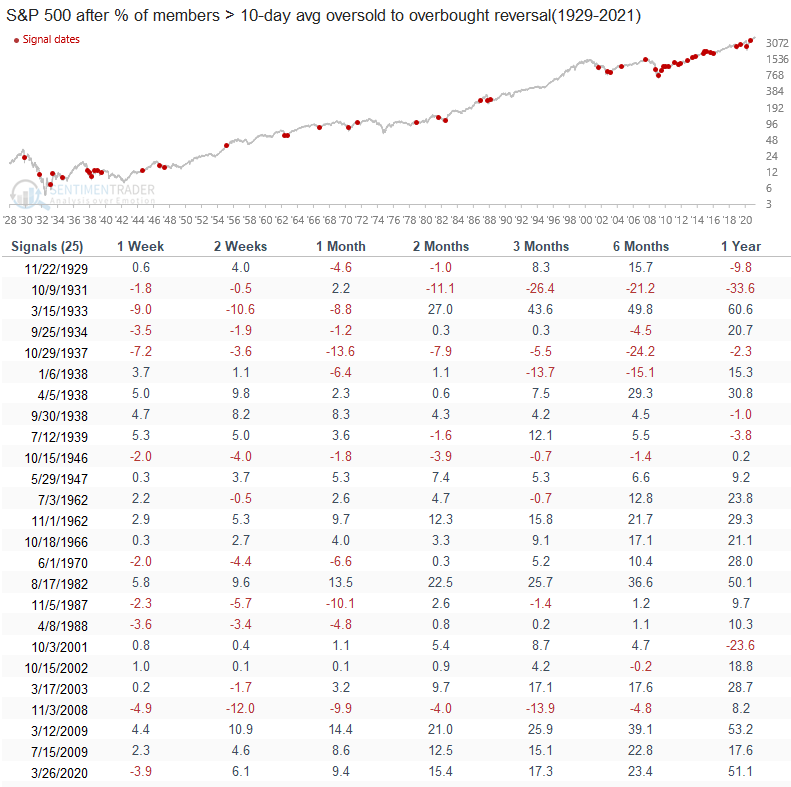
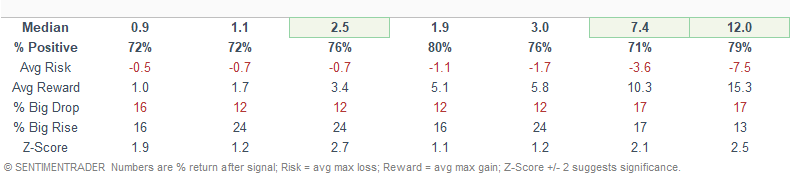
Signal Performance (All)
Signal performance looks good with a significant risk/reward profile in 3/7 timeframes. I would also note that signals have become more frequent since the 2009 low.
Signal Conditions
Whenever I create new trading systems, I like to add some additional code to the model to identify the conditions under which a signal occurred. The historical chart examples contain two signal names. The "%10DThr1" naming convention represents bear market conditions, while the "%10DThr2 measures corrections.
Let's look at signal performance under the bear market and correction conditions. Please note, two signals occurred at a 252-day high. I excluded them from the bear market and correction performance tables.
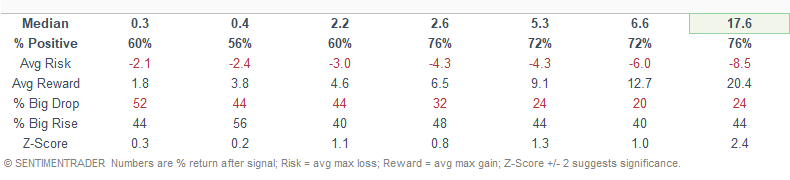
Signal Performance (Bear Market > 20%)
While the long-term performance results look good, the 1-4 week timeframe is choppy as volatility remains high in bear market periods. Please note the chart reflects all instances, whereas the table statistics reflect the signals in a bear market period.
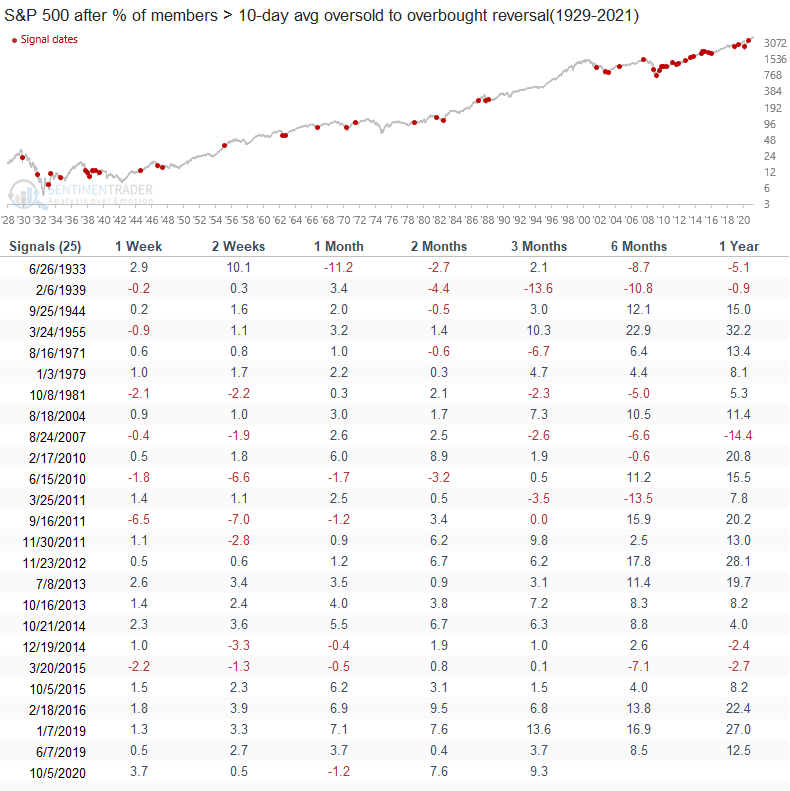
Signal Performance (Corrections < 20%)
Signal performance in correction periods looks solid across the board. Please note the chart reflects all instances, whereas the table statistics reflect the signals in a correction period.
Conclusion: The percentage of members above the 10-day average is an excellent tool for identifying a reversal from an oversold condition. One can use the method across indexes and sectors. Please note that the threshold levels need to be adjusted on an index by index basis. I am now in a wait-and-see mode for the financial and energy groups. Based upon today's action, it may not happen.