
Persistent Trend As Stocks Become Stretched


This is an abridged version of our Daily Report.
The most persistent trend
The persistence of the S&P’s uptrend over the past year is among the highest in its history. Same goes for the past 3, 5, and 10 years.
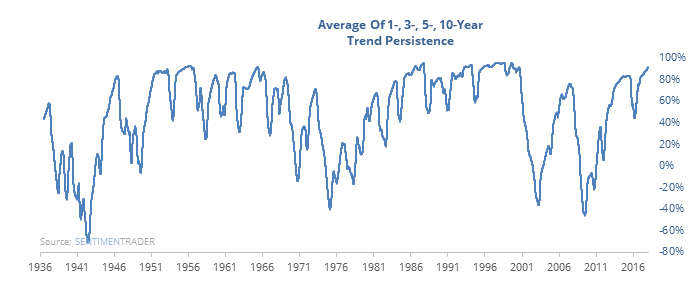
When we look at the 5 comparable trends, using the 200-day average as a guide was helpful.
Rubber band
The S&P is more than above its 200-day average for the first time in years. That’s not unusual following a bear market, but it is when trading at a multi-year high.
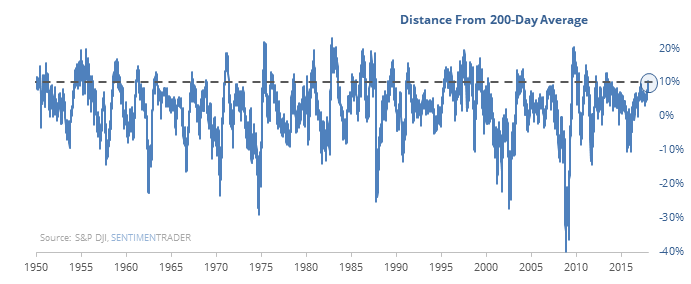
The others led to either persistent weakness, or not at all, with no real in-between markets.
Where’s the money?
Investors pulled more than $22 billion from equity mutual funds and ETFs in early January. That’s a new record outflow going back more than a decade. It doesn’t fit with virtually every other indicator we follow.
Record level of extremes
More than 52% of our indicators are now at an optimistic extreme. None of them are at a pessimistic extreme.
Good sign for natty
In the December 28 report, we looked at big rallies in natural gas from a multi-month low.
For access to the full report, indicators, charts, screens, and Backtest Engine, log in or sign up for a free 30-day trial today.