QQQ Bollinger Band Buy Signal

The percentage of QQQ members trading below their respective lower Bollinger Band registered a mean reversion buy signal on the close of trading on 5/21/21.
PERCENT BELOW LOWER BOLLINGER BAND BUY SIGNAL
The Bollinger Band signal seeks to identify instances in history when numerous Index members trading below their respective lower Bollinger Band cycles from high to low, and Index momentum turns positive. The model will issue an alert based upon the following conditions.
SIGNAL CRITERIA
1.) Percentage of members cross above 40. i.e., the reset
2.) Percentage of members cross below 0.9.
3.) If Condition1 and 2, start days since true count
4.) If Days since true count <= 5, and the QQQ 5-day rate of change is > 0%, then buy.
Let's take a look at the current chart and historical signal performance.
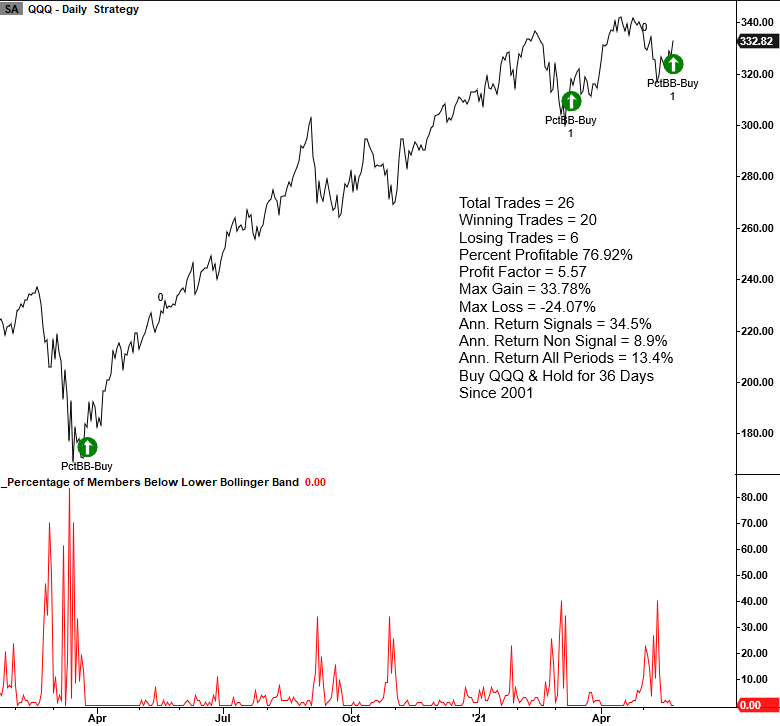
CURRENT DAY CHART
As the chart shows, this is the second buy signal in a little over two months. The 3/10/21 instance closed out the optimal days-in-trade holding period with an 8.72% gain versus a 7.47% gain for the SPY ETF.
Please note that the chart's trading statistics are based on buying and selling the next day open.
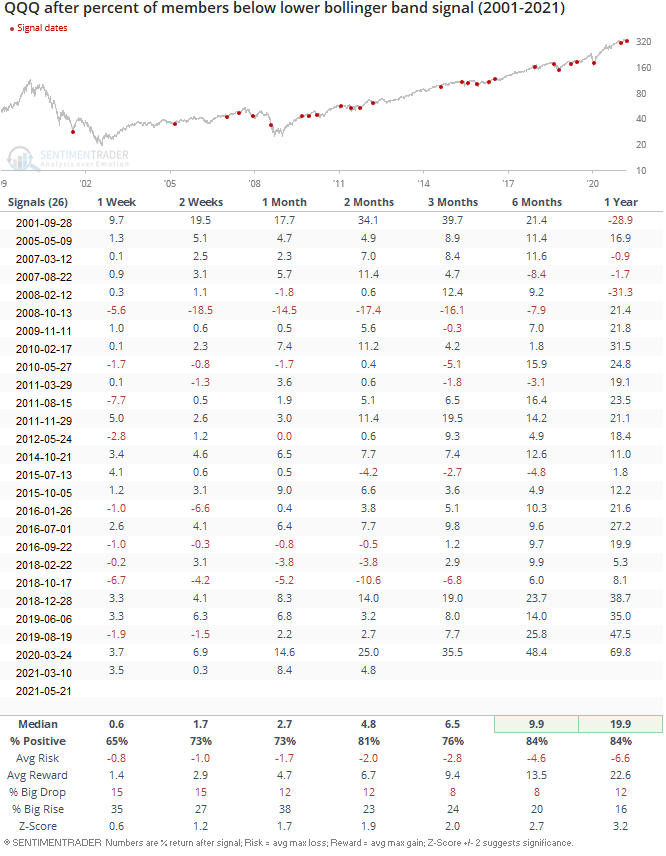
HOW THE SIGNALS PERFORMED