
Recovering from under the 200 day average

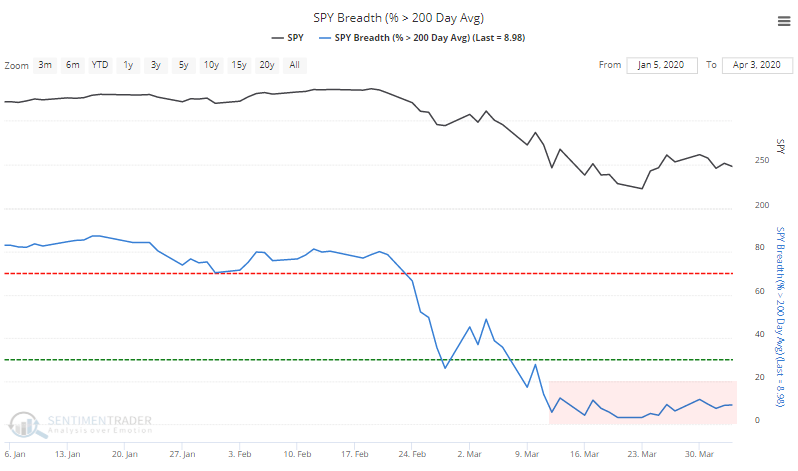
A lot of stocks were taken out in March and are struggling to recover. Over the past month, there has been almost no movement in the percentage of stocks within the S&P 500 (or most other indexes) that have managed to climb above their 200-day moving averages. Even with some very good days in the index itself (including Monday), this breadth metric hasn't responded much.
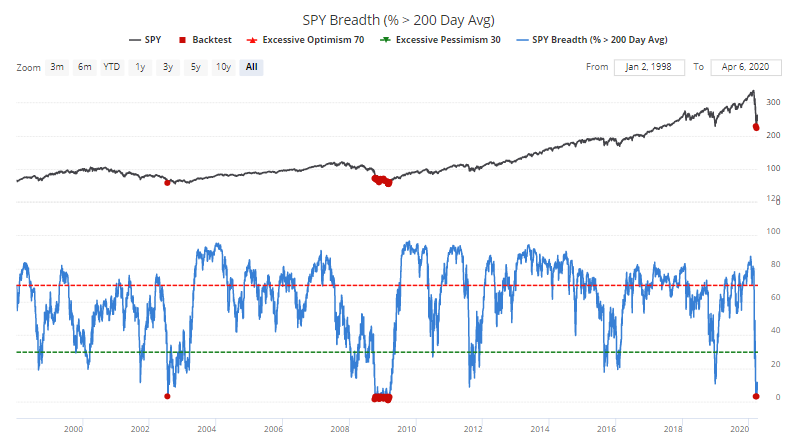
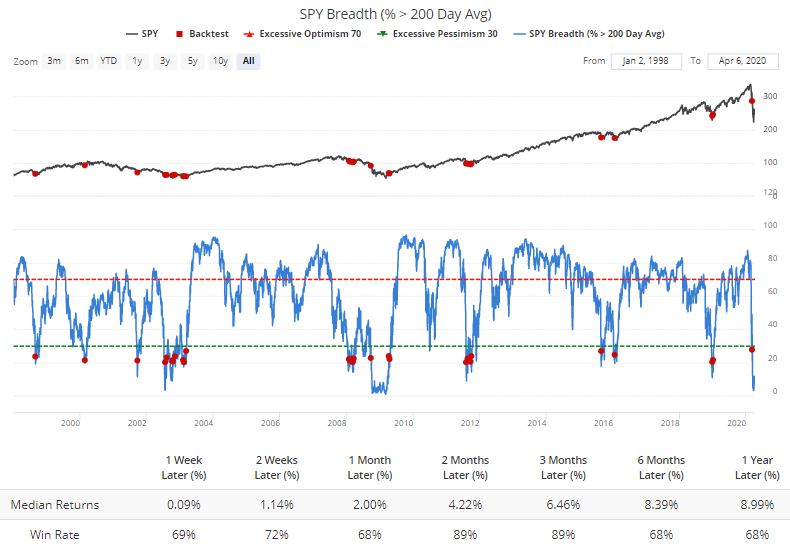
The Backtest Engine shows it's trying to recover from one of the worst readings in more than 20 years.
With all oscillating indicators, there is a balance between risk and reward. We can try buying after it reaches an extreme, with the risk that it will become even more extreme. Or we can wait for a recovery, which might reduce the "extreme can get more extreme" scenario but often we've already missed out on the best part of the recovery. There is no right answer; everyone's risk tolerance is different.
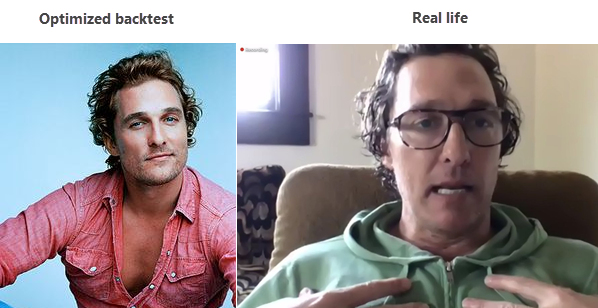
But maybe we can optimize the factors to see where the balance is best. With any optimization, we're relying on the future to look at least roughly like the past. For the most part it works, but it's like seeing a celebrity in a big-screen movie versus Zoom. They kind of look like we expected, but it's never quite as good.
Using Bloomberg's optimization engine, we can churn through a vast number of scenarios and look for combinations that led to the best results. There isn't any one measure to define what "best" actually means, but we're looking for a combination of high number of trades, high win rate, good return, and low drawdown.
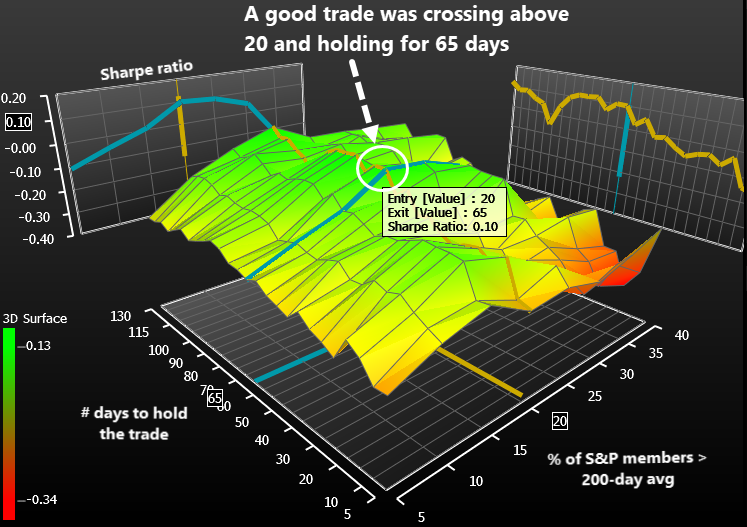
What we're doing is looking for times when the percentage of S&P 500 components above their 200-day moving average drops to a low level and then starts to recover. We'll buy and then hold for a while. The optimization will help us determine what level we should use for an entry (how many stocks need to close above their 200-day averages) and how long we should hold the trade.
According to these factors, we should wait until 20% of members are above their averages, and we should hold for 65 days. While other combinations led to better results depending on what factor we were looking at, this combination had one of the best Sharpe Ratios (we're not interested in the absolute value of the ratio, only its value relative to all other combinations). It also struck a good balance among the other factors like win rate.
When we use the Backtest Engine to look at how this performed over the past 20 years, it worked well, with good returns over the next 2-3 months. Some of them were false signals, but that's the risk we run when waiting for an extreme to reverse.
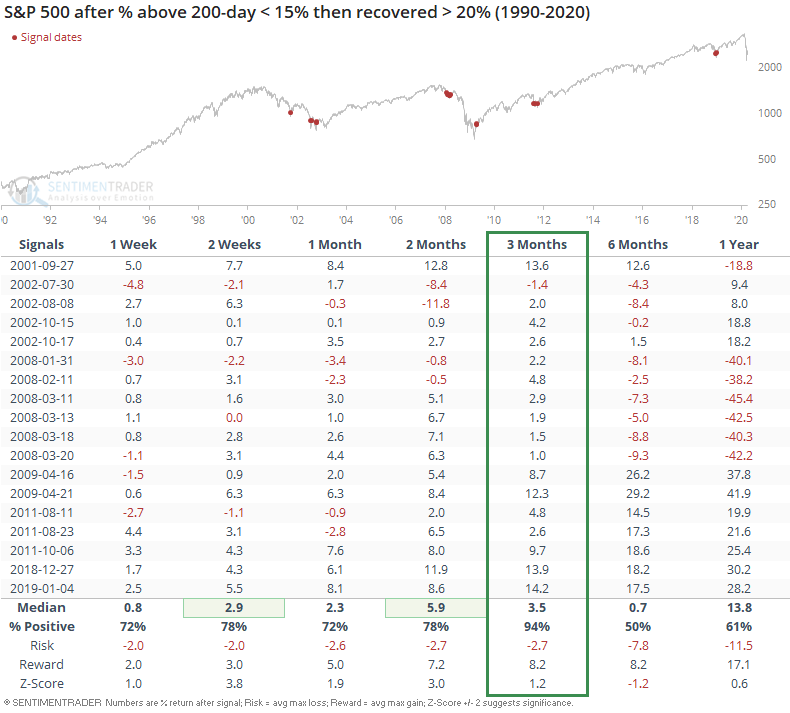
If we look for times when conditions had gotten really bad and fewer than 15% of stocks held above their 200-day averages at some point over the past month, then when this metric started to recover, there was only one small loss over the next 3 months.
 Again, there is no right way to approach this particular indicator (or any other). Different investors use different methodologies to try to match their different goals.
If we try to find the best balance between being too early vs late, and the risk of a major loss vs missing out on too much of a recovery, then one of the better options is to wait for this indicator to fall below 15% (which it has already done) and wait for it to recover above 20%. If we see that in the coming days, then it should be another good sign of a multi-month recovery.