
Regarding Fear and Loathing in September and October

Among investors, there are two basic "camps" these days - "Camp What, Me Worry?" and "Camp Fear and Loathing."
Those rowdy folks over at "Camp What, Me Worry?" are having a terrific time of it. The "weather" has been perfect all year, and in his latest forecast, their head meteorologist (a fellow by the name of Powell) is widely believed to have said in so many words, "Clear skies ahead." As a result, many of the campers at CWMW are not only loudly enjoying their ever-increasing profits but - now more than ever - are absolutely certain that ever-increasing profits will continue to be a "thing" well into the foreseeable future.
And they're getting pretty vocal about it too.
Meanwhile, across the way, the folks over at "Camp Fear and Loathing" are a much grumpier lot these days. Sure, they may have some money in the market and could be accumulating some wealth, but they just cannot get comfortable with all of the endless ruckus ("The market is crazy" is the most commonly heard refrain at CFAL). And besides, all of those rowdy folks over at Camp What Me, Worry? are making far too much noise.
How long can this status remain quo? Will anything change between now and the end of the year?
Let's take a look at a particular seasonal tendency, and you can draw your own conclusions.
THE SEPTEMBER/OCTOBER CONUNDRUM
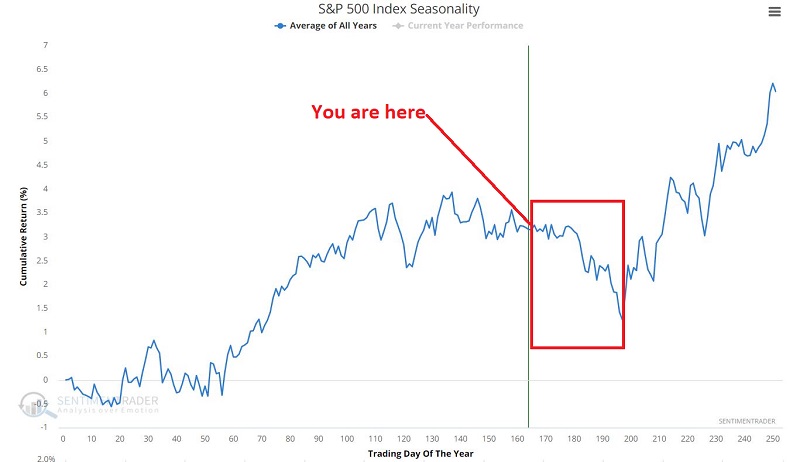
The chart below displays the Annual Seasonal Trend for the S&P 500 Index. The tendency for weakness in the months directly ahead is fairly obvious.
Another take on seasonality specific to 2021 appears in the chart below - created by and courtesy of Ned Davis Research - which has been widely circulated on the internet lately. It uses NDR's own combination of seasonal trend measures and displays their anticipated seasonal trend for 2021.
- The dark blue line displays their anticipated seasonal trend
- The dashed line displays the actual performance for the S&P 500 Index this year
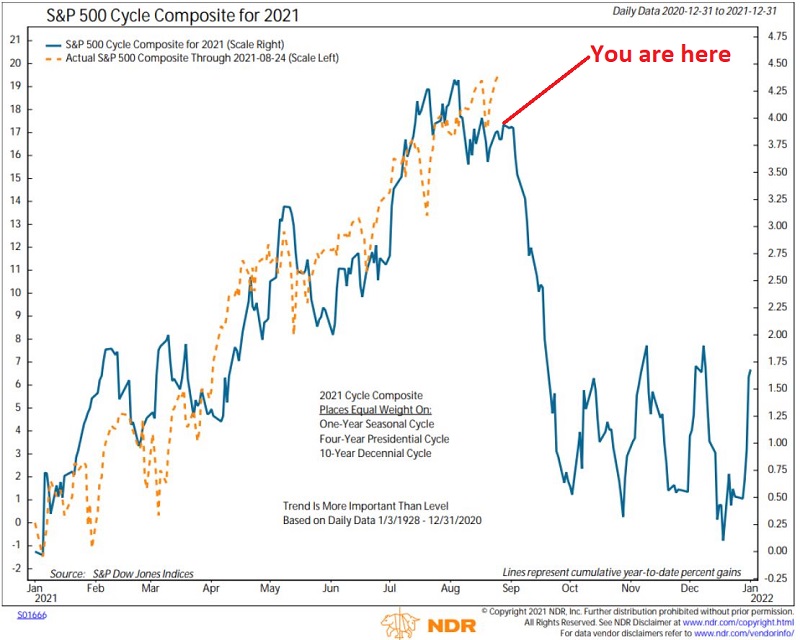
Notice anything?
- The good news is that the market has advanced all year, pretty much "on schedule"
- The bad news is that there is the potential for significant weakness during September into October
LOOKING AT TWO-MONTH PERIODS
The table below breaks average yearly historical performance for the Dow Jones Industrial Average into two-month segments each year from 1900 through 2020.
To understand the results in this table, note that the first line looks at the performance achieved by holding the Dow ONLY during December and January every year. As you can see, this two-month period showed a gain 66% of the time with an average gain of +2.2%.
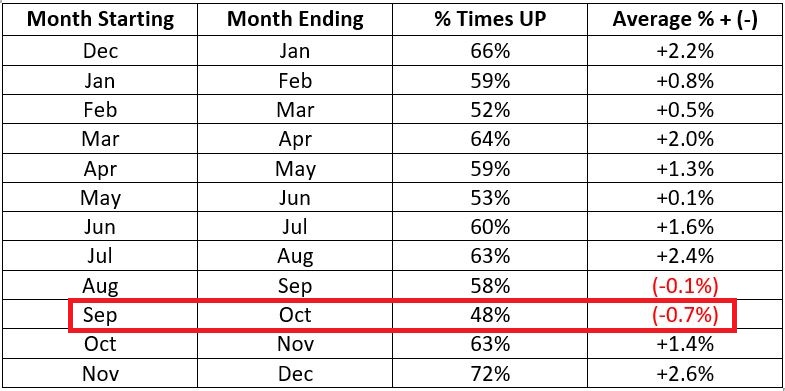
We see that historically the September/October period has been the worst-performing two-month period for the Dow.
Things to note regarding the September/October two-month period. It has:
- Showed a gain less than half the time (48%)
- Showed an average loss of (-0.7%)
The chart below displays the year-by-year September/October % gain or loss for the Dow.
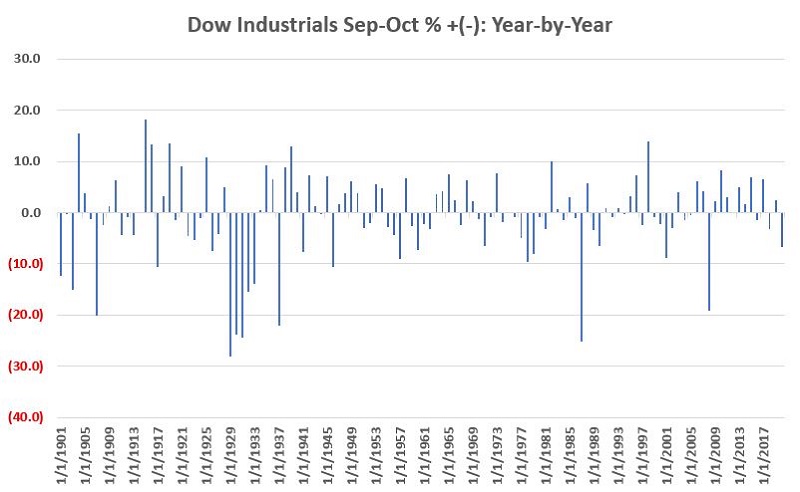
- On the one hand, there have undeniably been several devastating market declines during this period
- On the other hand, from year to year, the results are roughly a coin-flip
Finally, the chart below displays the cumulative % price return for the Dow Industrials if held ONLY during September and October every year from 1900 through 2020.
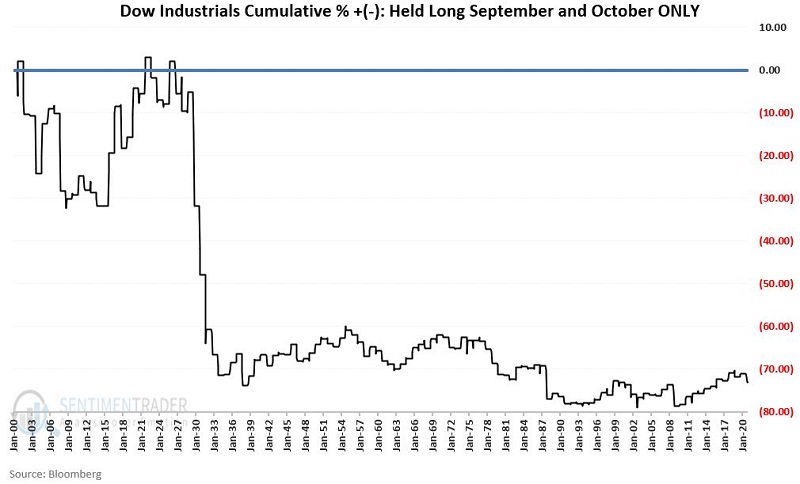
The bottom line:
- Since 1900, the Dow held ONLY during September and October has declined -73.7%
- Still, since reaching a low in 2008, this period has seen the Dow gain +26.3%
Will the party continue at "Camp What, Me Worry?"
Or will the folks at "Camp Fear and Loathing" be vindicated?