
Retail Investor Confusion As The Vol Trade And Bitcoin Roll

Stocks are recording another up day, on lower volume and with a smaller range. Maybe all of the quant folks have made patterns like this useless - they have certainly seemed to lose some effectiveness in recent years - but this is a classic rebound pattern from a large loss. Historically, there has been an extremely high probability that this leads to losses over the ensuing week(s).
Following are some other items that popped up on my radar today.
RETAIL IS ALL IN...OR NOT
Michael Santoli is a mainstream journalist who "gets it". He had a series of tweets outlining the argument that markets cannot top because retail, mom-and-pop investors are not yet fully in. In a twist, he noted that the arguments were from his very own article...in July 2007. Great perspective.
https://twitter.com/michaelsantoli/status/866451942758903808
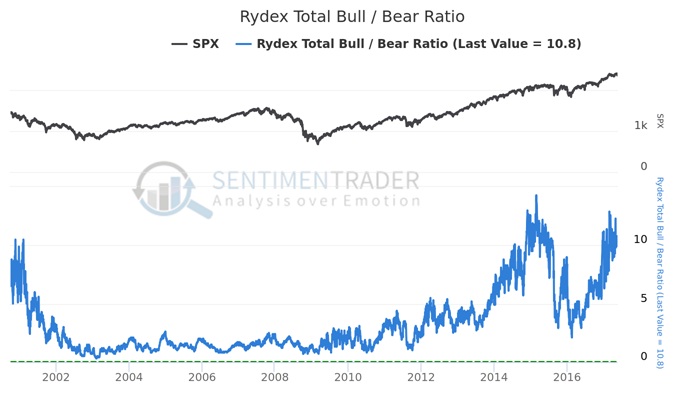
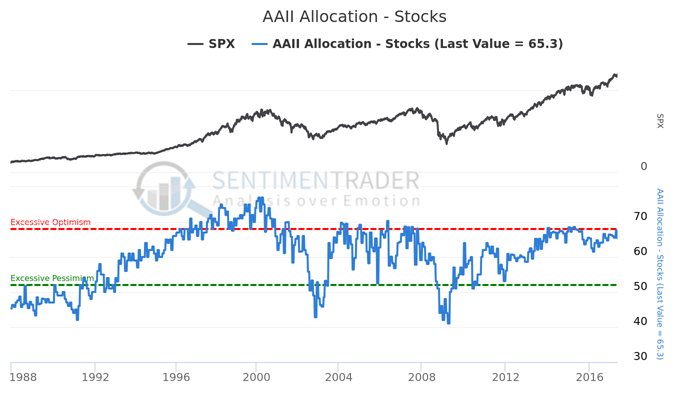
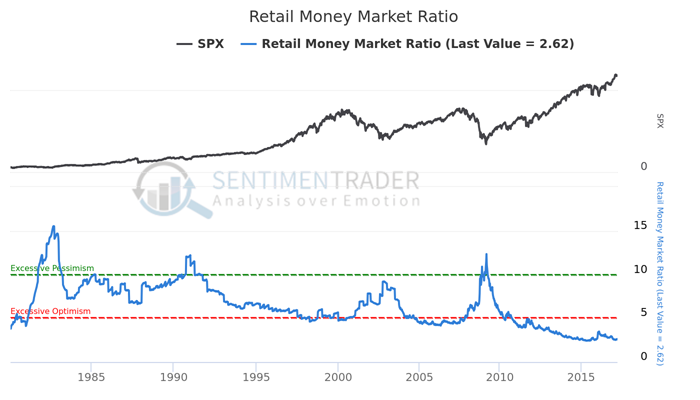
The argument that the retail investor is not fully invested is arguable, of course. We can all pick and choose an indicator or two that shows a compelling argument for one side or the other. But the counter-indicators (the ones suggesting that retail investors ARE nearly fully invested) are far more numerous.
Santoli has a typically good article on CNBC overviewing the current mood of individuals, and as noted, it is mixed depending on the choice of indicators. As he notes:
Yale economist Robert Shiller has surveyed professional and amateur investors for decades about their market expectations. Right now, both groups' confidence that stocks will rise over the next year is near a multi-decade high. Yet the counterpart "Buy the Dips" and "Crash Confidence" indexes show elevated anxiety that the good times could end suddenly and painfully.
He's certainly right about the confidence indexes. According to the Yale polls, investors have never really been as confident of a one-year rally as they are now. In the charts below, we overlaid the S&P 500 as an approximation of where stocks would have been about the time the survey was taken. Yale doesn't give out the data, so it's not exactly representative.
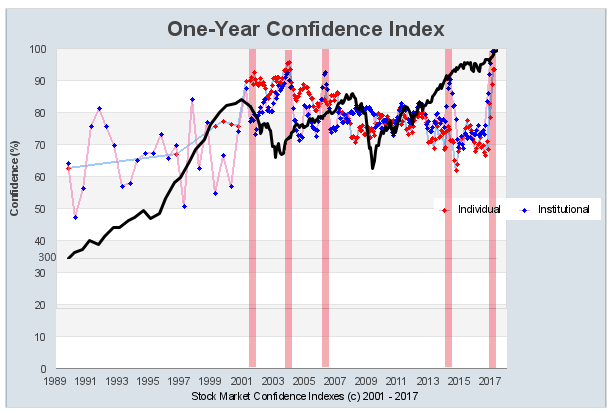
Investors were extremely confident of rising prices in 2001-02, again in 2004 and then in 2006 and 2014. Mixed record, but stocks did have a hard time making substantial gains afterward, at least over the next 6-12 months.
That's tempered by the idea that investors are also NOT confident that there WON'T be a market crash. The double negative makes that a confusing statement, but the below chart can be looked at as a form of overbought/oversold measure:
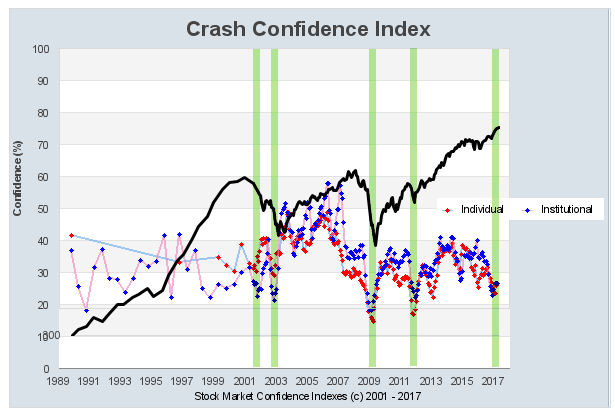
It typically moves counter to the other Confidence index, but is diverging now. It's hard to eyeball, but the only times we saw extremely high confidence in rising prices and low confidence that there won't be a crash were in 1998 and 2000.
It's not just retail that's (probably) heavily invested. Pros are too.


LOW VOL IS A SLAM-DUNK TRADE
Apparently the "low volatility" bet continues to prosper, and insta-recoveries like last week will only embolden them.
The St. Louis Fed noted that their stress index continues to tick along near all-time lows. Not surprisingly, that has an exceptionally high correlation to the VIX.
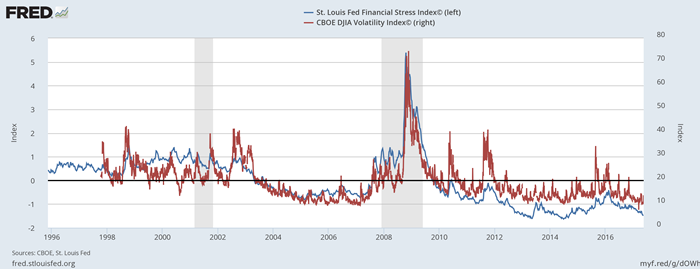
As long as stress is low and v-shaped recoveries are the norm, might as well lever up the anti-volatility trade.
https://twitter.com/tracyalloway/status/866634046952153090
The well-documented concerns with low volatility revolve mainly around the idea that lack of movement causes investors to increase allocations to stocks, which loops back and helps further suppress volatility. As noted by the Wall Street Journal on Friday, that means allocations to stocks in so-called risk parity funds has soared above previous highs. I superimposed the S&P 500 over the Journal data to show how stocks have responded after other periods of extremely high risk parity stock exposure:
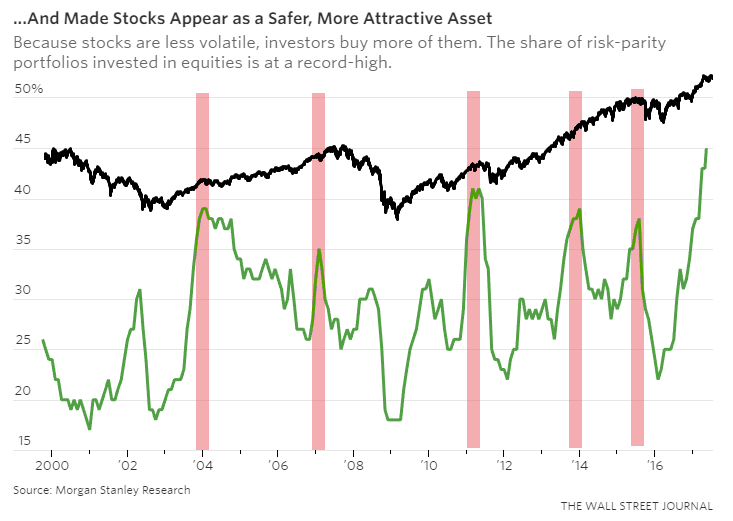
This probably will not end well.
BITCOIN SURGES AGAIN
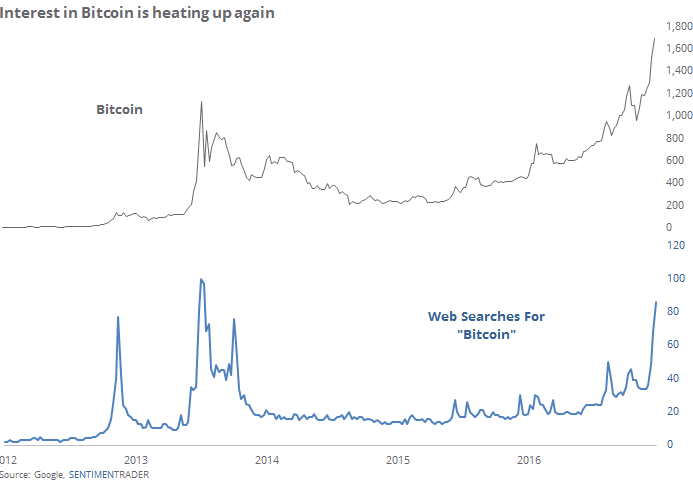
Interest in the alternative currency Bitcoin has surged along with its price. Web searches for the currency have skyrocketed and are nearing the previous record from 2013, which led to a gradual erasure of all of the excited gains.
Twitter folks have picked up their interest as well, though not quite exceeding prior highs.
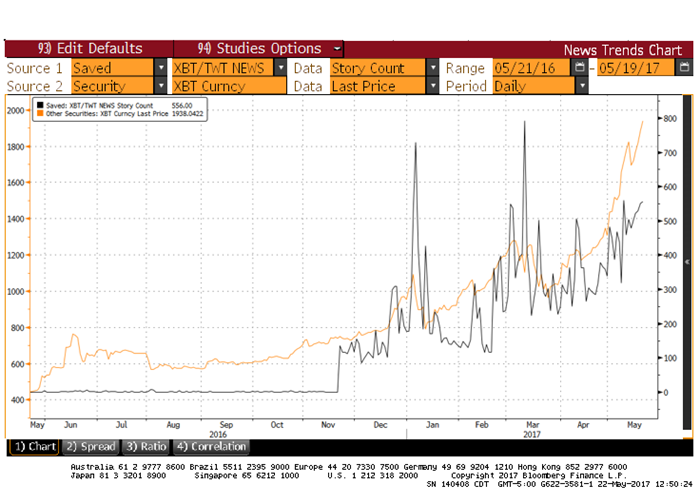
The astute Tommy Thornton noted that as Bitcoin has jumped, it just recorded an exhaustion signal as denoted by the analysis technique pioneered by Tom DeMark and Larry Williams. Recording a "13" very often precedes at least a short-term pause, no matter the data series.
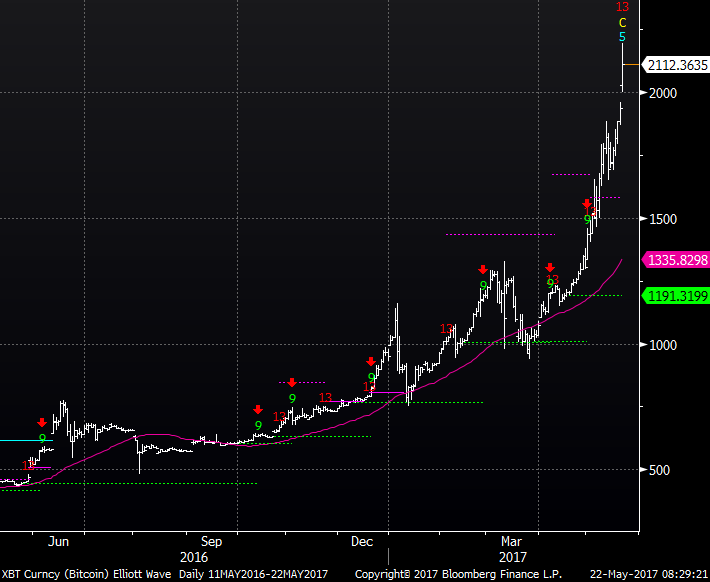
This is probably a good spot to assume that future (and likely recent) gains will prove to be temporary.