
Rising Instability After a Historic Stock Market Rally
Markets are demonstrating historic levels of complacency. This may be great if you're a tech stock speculator or a Robinhood 20%-profit-a-month trader, but in the real world this is a dangerous time to throw caution to the wind from a risk:reward perspective.
*If you think we at SentimenTrader are permabears, please simply go through our Twitter feed and look at our bullish tweets from late-March.
I'm going to share almost 20 indicators and charts that are CRITICAL to understanding the market's short term outlook right now. Some of these indicators/charts are new, and others I've covered on Twitter. These indicators focus on the short-medium term. They are not meant for long term investing. So if an indicator is short term bearish for stocks, that DOES NOT mean stocks can't rise over the next year (long term).
We take a weight-of-the-evidence approach to trading that respects the market and examines risk:reward from multiple points of view. While any one of these indicators don't constitute a market call, you should ALWAYS think for yourself if any of these indicators are important. Do not let anyone on the internet (including myself) do your thinking for you. These data points are merely meant to guide you in your trading analysis process. So monitor them carefully and think critically.
So without further ado, we'll look at the following:
- Rolling over sell signals
- Options frenzy
- Analysts are chasing the rally
- Insane momentum
- Sentiment (on steroids)
- Weakening breadth
- And more!
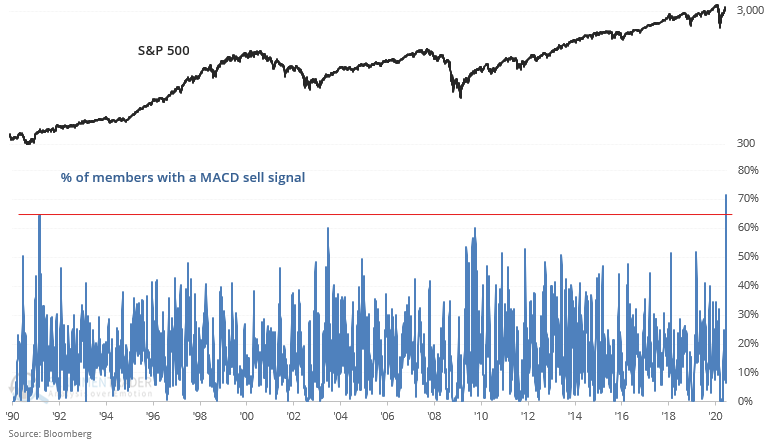
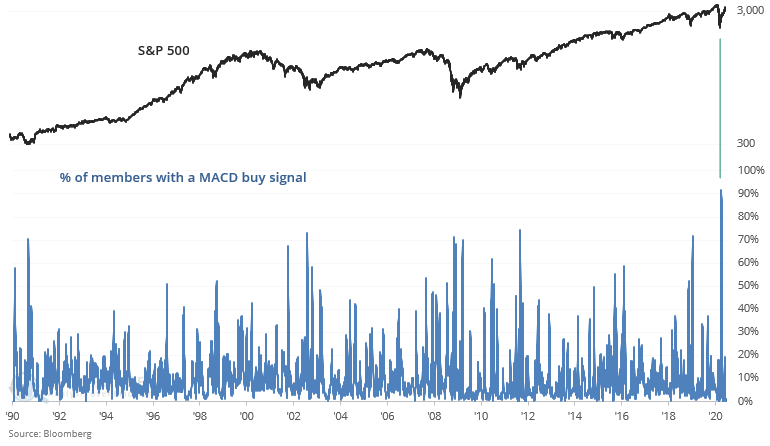
Sell signals
The U.S. stock market stalled after June 8. While the S&P may have already pulled back from a potential peak, there is still further downside risk. The stalled rally has triggered a RECORD number of MACD sell signals among the S&P 500's members. While historic extremes could mean that the bull market is just getting started (see early-1990s, 2003, 2009), historical cases all led to short term losses for investors.
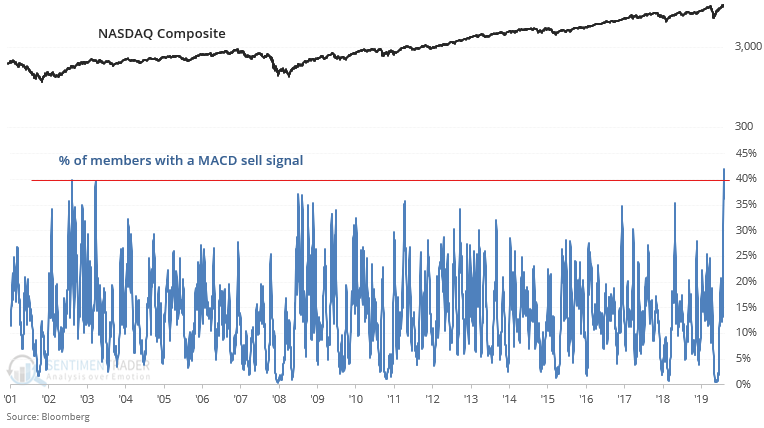
We're not just seeing such truly rare levels on the S&P 500. A record number of NASDAQ Composite members have also witnessed MACD sell signals:
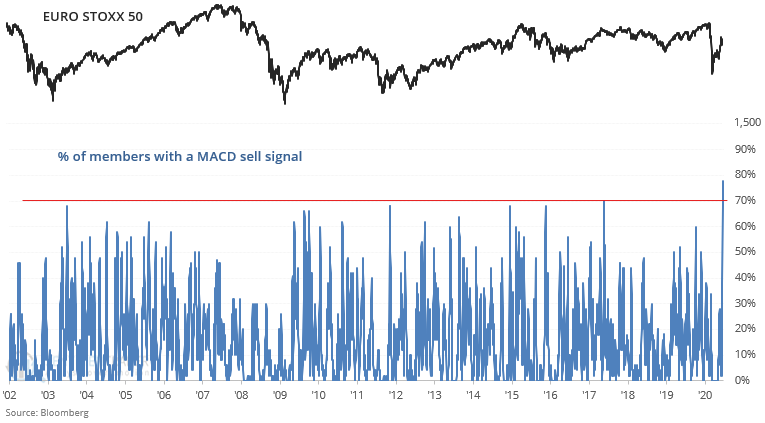
To add fuel to the fire, many overseas equities are rolling over as well. A record number of Euro Stoxx 50 members have triggered MACD sell signals:
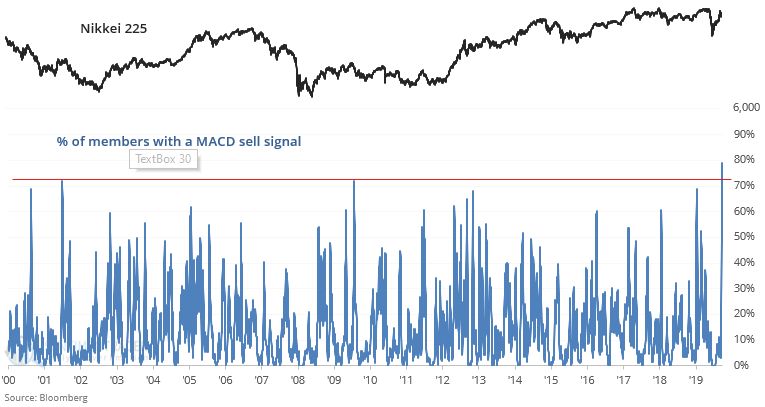
And in Asia, a historic number of Nikkei 225 members have triggered MACD sell signals.
What we're seeing right now is EXACTLY THE OPPOSITE of what we saw at the stock market's bottom in late-March. Back then, a record-breaking % of S&P 500 stocks triggered MACD buy signals.
Moving on, let's look at the full-bore bullish options traders.
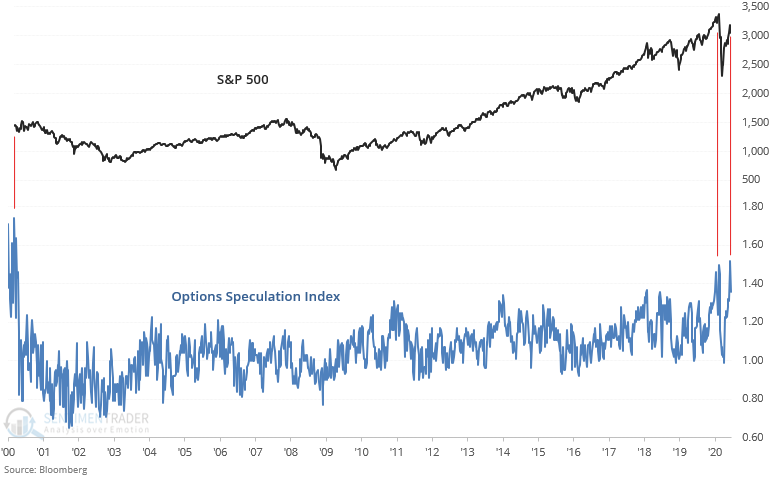
Options frenzy
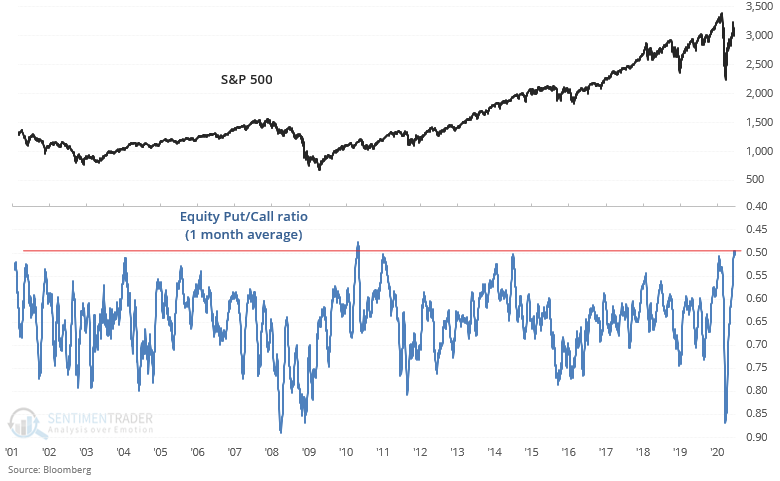
Options traders have gone balls-to-the-wall long as they bet on a continuation of the stock market's already historic rally. As we've shown repeatedly on our Twitter feed, traders and speculators are buying calls like there's no tomorrow. The Equity Put/Call ratio's 1 month average has reached a level where historically, stocks almost always pulled back over the next 2-3 months:
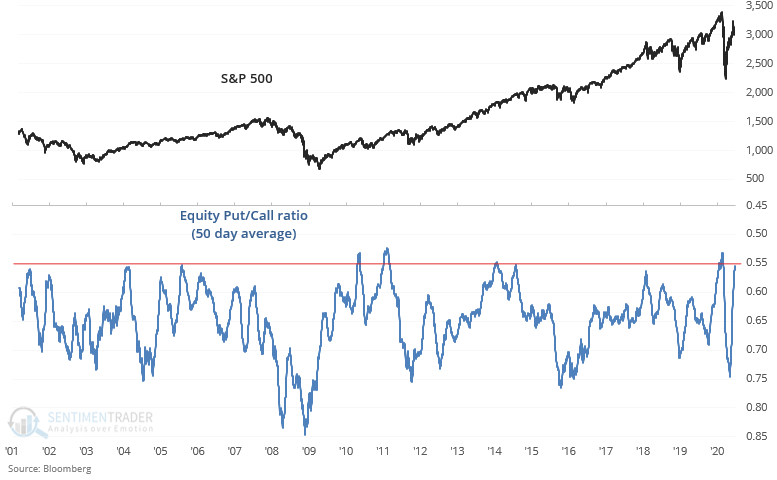
Looking at a different time frame, the Put/Call ratio's 50 day average is equally extreme. The last time this happened was in January-February 2020, just before global equities CRASHED in March.
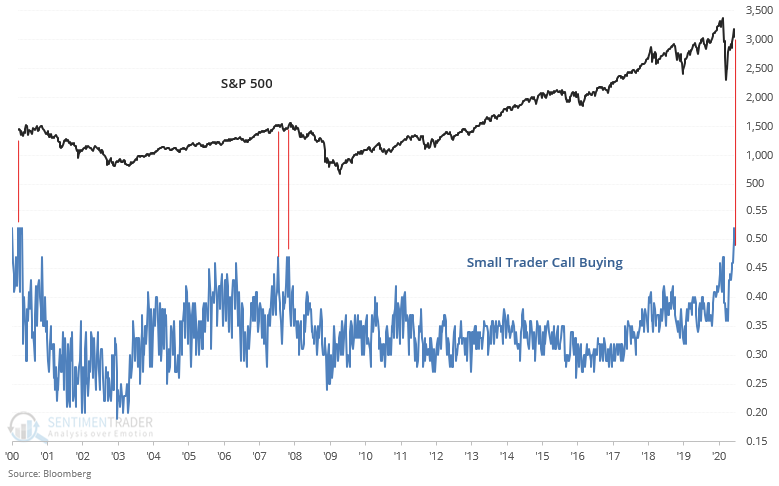
Among the most bullish options traders are small traders, who surely have enjoyed outsized gains over the past few months. The Small Trader Call Buying ratio, which looks at the % of total small trader option volume that went to buying call options, was recently at the highest level in 2 decades! This is eerily similar to the speculative frenzy we saw at bull market tops in 2000 and 2007.
Similarly, our Options Speculation Index, which is a ratio of the total bullish transactions vs. total bearish transactions among all U.S. options exchanges, is at the highest level since the dot-com bubble. Risks are mounting, and bullish options traders could be driving over a cliff.
Analysts are chasing the rally
Analysts were recently upgrading their price targets for S&P 500 stocks at the fastest pace ever. Keep in mind that at the S&P's bottom in March, analysts were downgrading at the fastest ever. Prior instances of analysts chasing the rally almost always led to a S&P 500 pullback/correction in the next 2-3 months.
*It's not that all analysts are bad. It's just that like many traders, it's easy to let the market's price guide your thinking (which is dangerous for your trading account). Like our friend Helene Meisler likes to say, there's nothing like price to change sentiment.
Insane Momentum
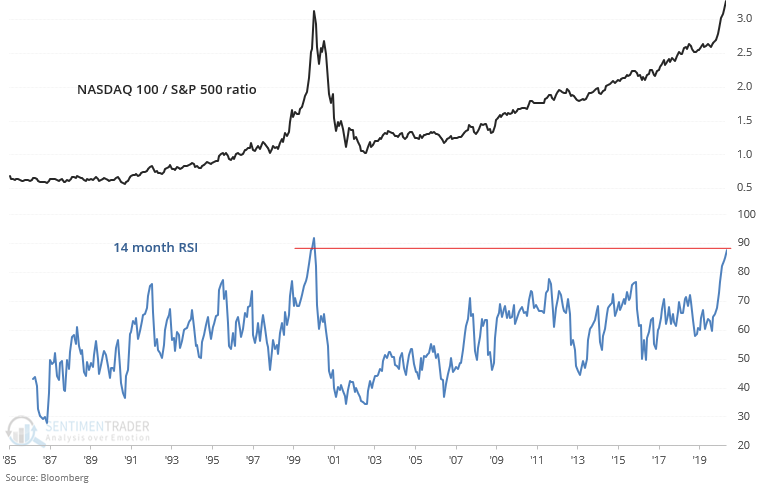
Twitter is an interesting exercise in crowd psychology. Twitter is full of "MARKETS WILL CRASH MUCH FURTHER" comments at market bottoms and "THE MARKET WILL SOAR TO UNIMAGINEABLE HEIGHTS" at market tops. But thusfar, there has been good reason for the bullishness of many traders using Robinhood, Twitter, and Reddit. Stocks, and in particular tech stocks, have rallied nonstop.
This incessant demand for all things internet and tech has pushed the NASDAQ 100 / S&P 500 ratio's 14 month RSI to the highest level since the peak of the dot-com bubble. Moreover, the ratio itself is higher than where it was during the dot-com bubble. While many traders were getting-rich-quick during the 1990s bubble, many traders also lost their shirts (and wallets) during the subsequent dot-bomb bust.
One of the most popular strategies among small speculators is to buy small cap growth stocks. These stocks provide the potential for ENORMOUS short term gains (and also enormous short term risk, but who cares about risk these days right?).


The popularity of small cap growth stocks among Robinhood traders has no doubt been are encouraged by popular Youtube gurus that preach make-2%-a-week make-1%-a-day trading tactics. As a result, the Russell 2000 Growth/Value ratio's 14 month RSI is close to an all-time high. This only happened:
- February 1980: stocks crashed next month in March 1980
- December 1999: this was near the end of dot-com bubble
- July 2015: stocks crashed next month in Aug 2015
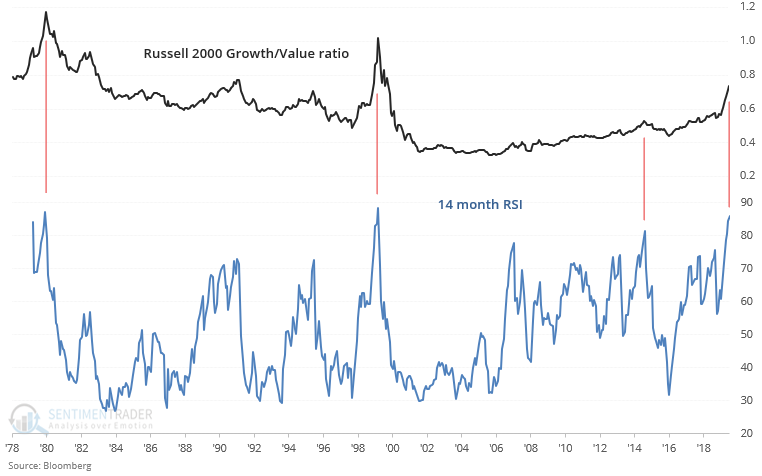
Remember, don't confuse brains with a bull market. As Warren Buffett says, "only when the tide goes out do you discover who has been swimming naked".
Sentiment (on steriods)
As one may expect, the stock market's spectacular rally has pushed various sentiment indicators to sky-high reading. Our CNN Fear & Greed proxy's 20 day average is at a level where over the past 2 years, typically led to a pullback/correction in the market.
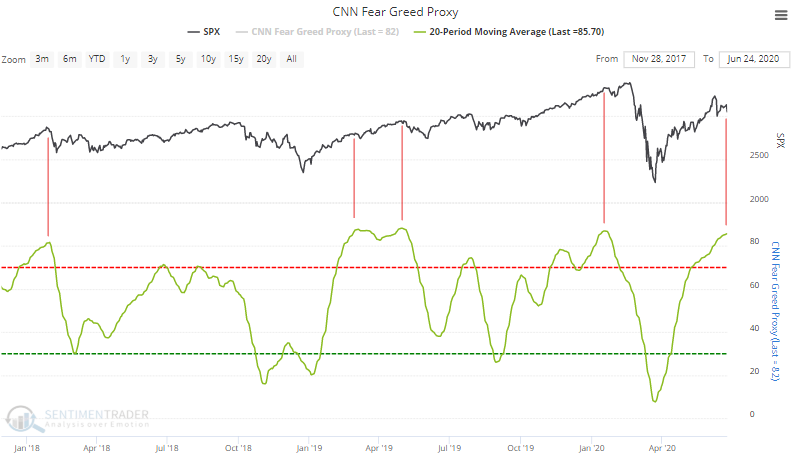
*This is our PROXY for CNN Fear & Greed. CNN Fear & Greed doesn't release their exact calculation method, so we've approximated it as close as possible. While individual days' nominal readings may be different from that of the actual CNN Fear & Greed Index, what matters is the RELATIVE level of individual days' readings.
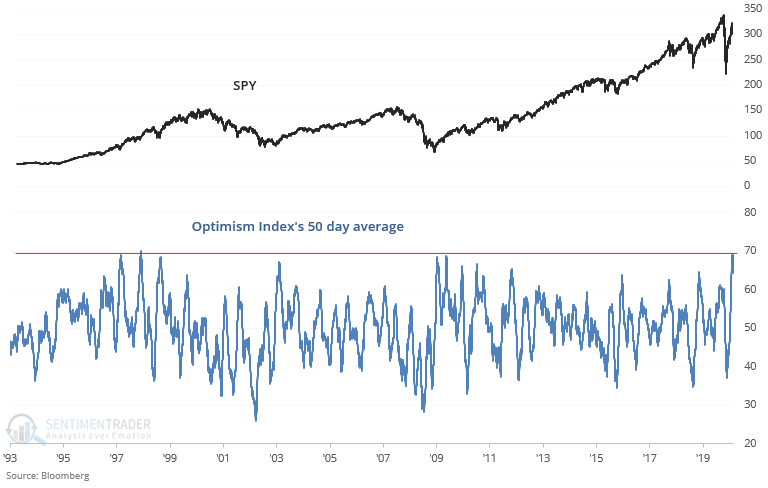
Meanwhile, our SPY Optimism Index is showing EXTREME complacency in the stock market. The Optimism Index's 50 day average was recently at the highest level in more than 20 years. While historical cases could lead to more gains for the stock market over the next year, they typically first led to losses over the next few weeks and months:
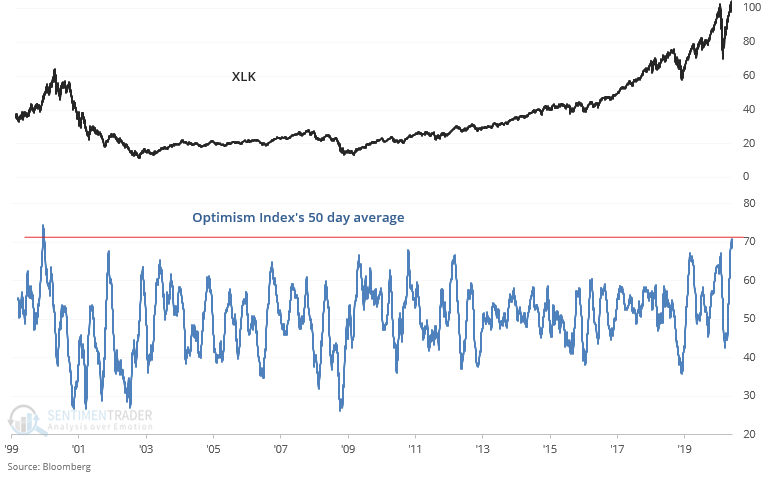
Such high sentiment is putting downwards pressure on stocks, and in particular tech stocks. XLK (tech ETF) optimism Index's 50 day average is at the highest since the dot-com bubble.
Once again, none of these data points are an outright bearish call. Please consider them for yourself and apply your own judgement. But with that being said, the following charts deserve special attention.
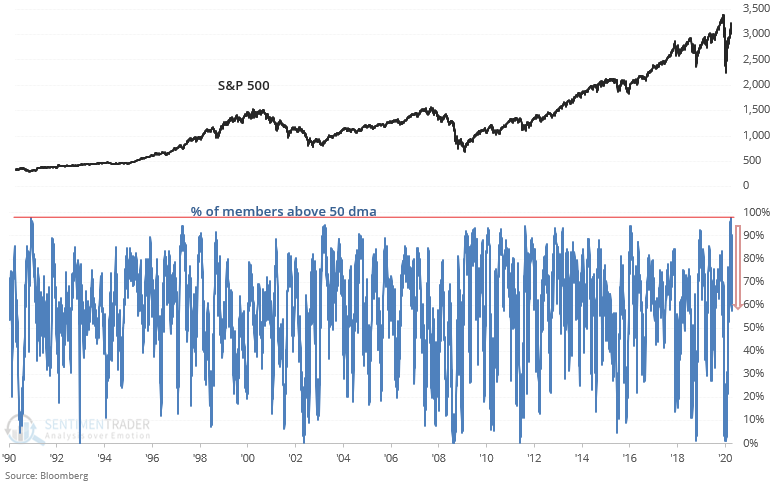
Weakening breadth
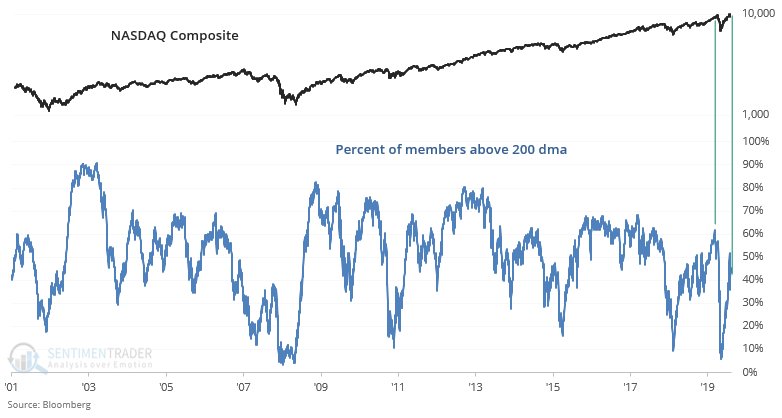
As I noted yesterday, the NASDAQ's rally has been exceptional in that it is more than 16% above its 200 dma (strong rally), while only 45% of its members are even above their 200 dma! This implies that the broad index is being pulled up by a select few members, while most of the index's members can't even reclaim their long term uptrend.
The only other somewhat comparable case (weak long term breadth + strong rally) was in February 2020, just before stocks crashed in March.
While many stocks were unable to reclaim their long term averages (200 dma), the VAST majority of them were able to reclaim their medium term trends (50 dma). After a record breaking % of S&P 500 members were above their 50 dma, many of these stocks are rolling over and losing their medium term uptrends (50 dma). This development should be monitored carefully and could portent further losses.
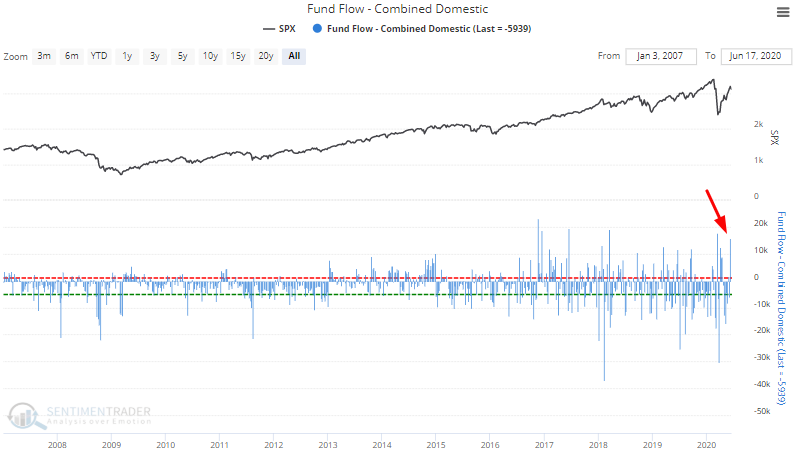
Fund flow combined domestic
And lastly, investors have gone from GET ME OUT OF EVERYTHING to JUST BUY ANYTHING over the past few months. We don't particularly like fund flow data for individual ETFs since these can be very erratic and noisy. It's far better to look at aggregate fund flow data. The past week saw extremely high inflows into U.S. equity ETFs and mutual funds. In trading as in life, it's better to zig when others zag.
Wrapping up
The history books are still being written and no one has a crystal ball. We can't predict anything with 100% certainty - all we can look at is risk:reward and weigh the evidence.
Data, facts, and history tell us that:
- Stocks (in particular tech stocks) COULD rally further, but there is a high risk of a violent shakeout.
- While the stock market could rally further over the next year (meaning now until mid-2021), risk:reward supports a short term pullback/correction. Nothing changes until everything changes all at once.
I hope these indicators and charts have been useful. Instability is rising in the markets after an epic multi-month rally, so stay vigilant and monitor market developments closely. And as always, stay safe during the current pandemic. Health > wealth
Regards,
Troy Bombardia and the SentimenTrader team
Follow us on Twitter @sentimentrader and @bullmarketsco
If you're interested in more indicators, charts, and research like this, please sign up to our 30 day free trial.