
Risk is wrong as dumb money is right

A little less than a month ago, we look at what has happened when "dumb" money has been so smart. Despite extremely high optimism among investors who tend to be most wrong at the extremes, stocks have continued to power higher.
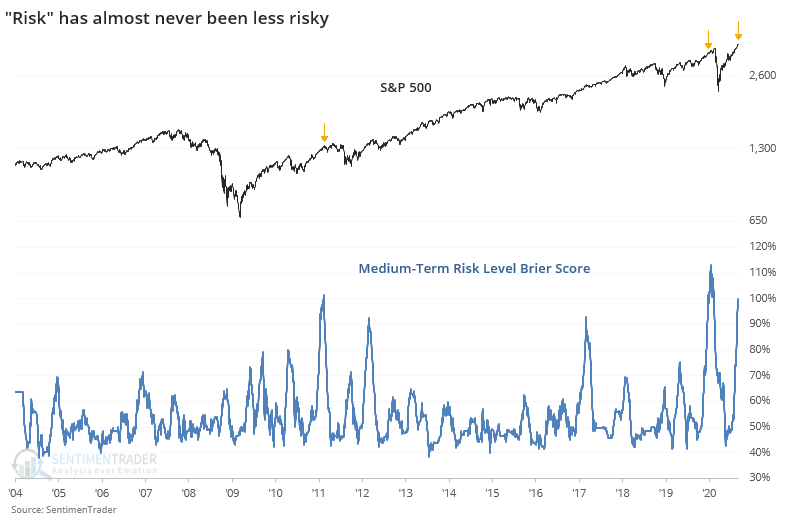
Because optimism was high, and the market environment has been neutral at best, the Medium-Term Risk Level has been elevated for a long time. It has failed. Maybe Thursday's losses are a signal that is changing, but it's way too soon to tell.
We can quantify these failures using a Brier Score. The higher the score, the more the indicator has failed to precede the typical outcome. We've gone almost a month since looking at it last, so if we extend the time frame and look at a 2-month average of this Brier Score for the Risk Level, it's nearing unprecedented territory. In other words, it's almost never failed to this degree.
It's not something we'd choose to celebrate, but we also aren't in a habit of sweeping failures under the rug. Often, they can give us important clues about changes in the market environment or structure.
There have only been two other times since we've been aggregating this data in 1998 when the Score got this high, for this long.
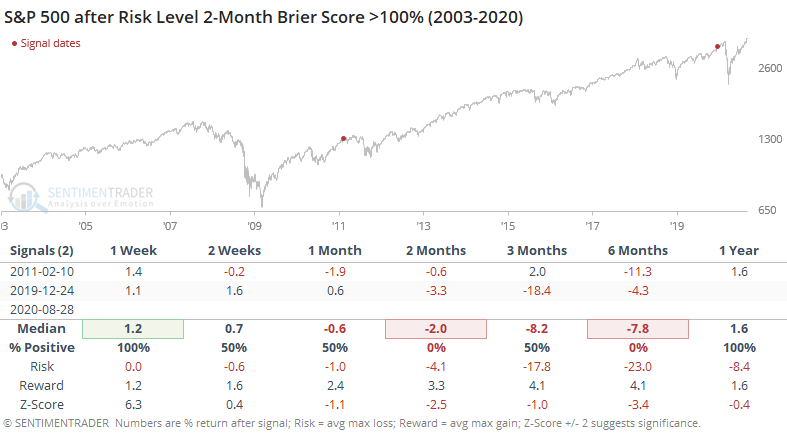
By the time we all wanted to throw everything into the dustbin and just succumb to the momentum, was almost exactly the time when markets started to revert again.
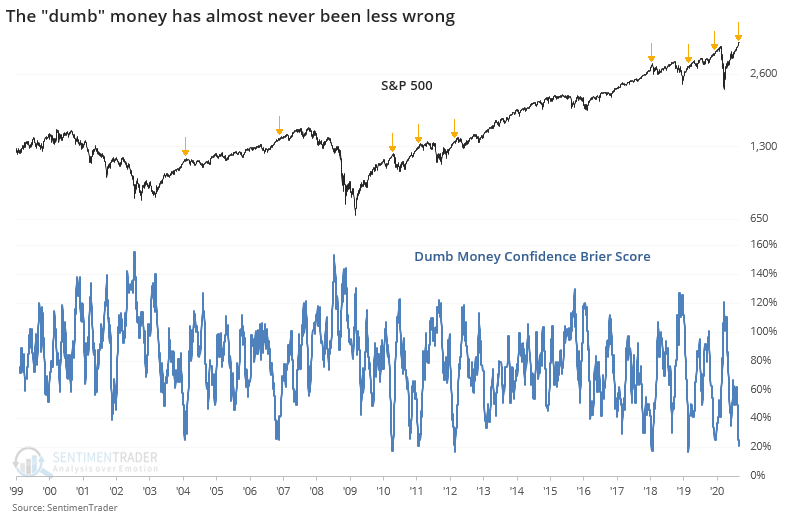
Dumb Money Confidence is an important input to the Risk Level, and the Dumb Money has almost never been more right. Its Brier Score over the past 2 months is nearing a record low. Because a high score means the typical outcome is not occurring, a low score means that the underlying indicator has been right.
After these traders have been so right for so long, stocks struggled.
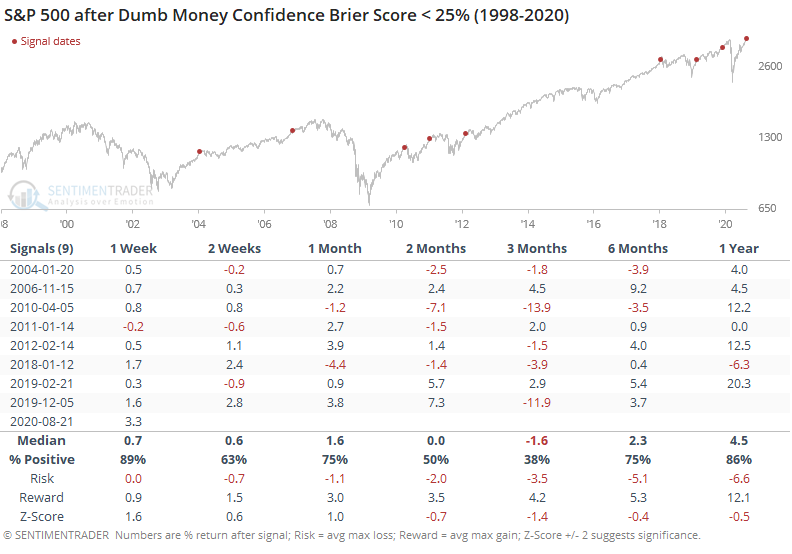
Over the next 3 months, the S&P's average return, win rate and risk/reward were unimpressive. The two exceptions were 2006 and 2019, when stocks levitated for many more months before ultimately giving back all of the gains and then some.
Watching the failure of indicators is a good way to get a heads-up that the environment is shifting. There are some signs that's the case now, but not enough to abandon them altogether and assume it's all clear. Especially if behavior like Thursday sticks for more than a day or two.