Products
SentimenTrader Trading Tools
‍
Backtest Engine
My Trading Toolkit
Correlation Analysis
Seasonality
Market Prediction
Indicators & Data API
‍
Proprietary Indicators & Charts
Market Data API
Strategies & Scanner
‍
50+ Trading Strategies
Smart Stock Scanner
Smart Option Scanner
Research Reports
‍
Research Solutions
Reports Library
Free Resources
Simple Backtest Calculator
Simple Seasonality Calculator
The Kelly Criterion Calculator
Sentiment Geo Map
Public Research Reports
Education
Sentiment Indicators
Technical Indicators
Pricing
Company
About
In the News
Testimonials
Client Success Stories
Contact
Log inLoginSign up
< BACK TO ALL REPORTS

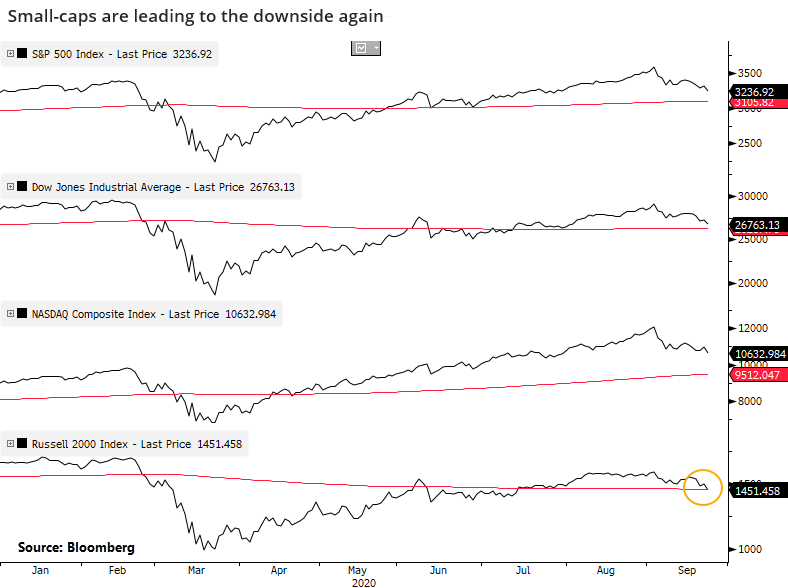
Russell 2000 is the first to lose its long-term trend

Jason Goepfert
2020-09-24
The Russell 2000 became the first of the 'big four' indexes to close below its 200-day average after all 4 had been rallying. It also ended a medium-term rally within a much larger downtrend for the index. Similar behavior in the past led to short-term declines, but not much beyond that.

When markets started to crack in February, it was smaller-cap stocks leading to the downside.

That has to bring up some bad memories because it's happening again. The Russell 2000 is the first of the "big four" indexes to fall below its 200-day moving average.

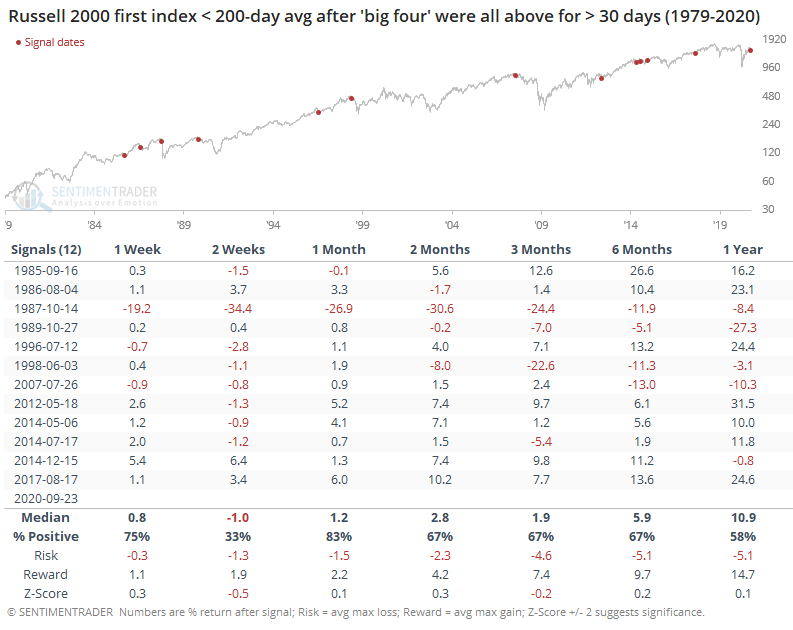
When it led to the downside, its shorter-term returns were poor. The table below shows the Russell 2000's returns when all four indexes had been above their respective 200-day moving averages for at least 30 days, and then the Russell was the first index to fall below.

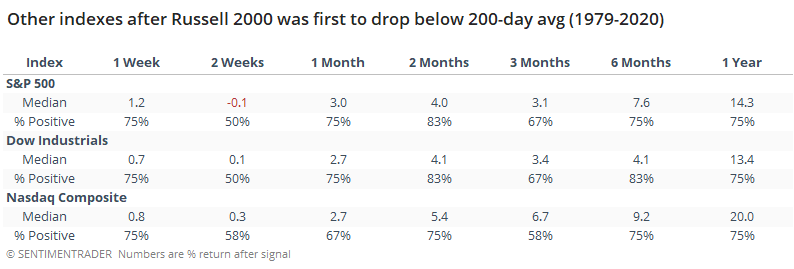
The other indexes held up better.

Focusing on the Russell alone, it's been more than 500 days since that index peaked in 2018. So the July-September period when it was hovering above its 200-day average was counter to the long-term trend it's been in.

Below, we can see the index's returns when it had been at least 200 days since a multi-year peak, and then it fell below its 200-day average after having been above it for between 10 - 100 days. In other words, the end to a short- to medium-term rally within a longer-term downtrend.

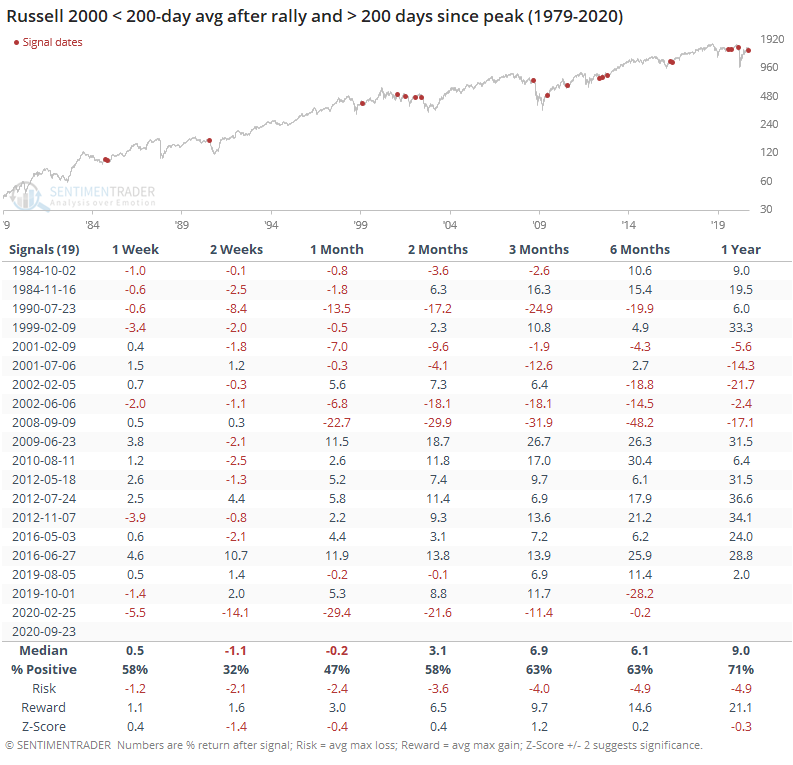
Again, fairly weak for the Russell in the shorter-term. Much of the risk over the next few months was focused on the first few weeks. Based on these two looks at troubles among smaller company shares, it's a concern in the shorter-term, but not much beyond that.

PRODUCTS
SentimenTrader
Trading Tools
Indicators & Data API
‍
Strategies & Scanner
‍
Research Reports
FREE
RESOUrCES
Simple Backtest
Calculator
Simple Seasonality
Calculator
The Kelly Criterion
Calculator
Sentiment Geo Map
‍
Public Research Reports
‍
Education
Sentiment Indicators
‍
Technical Indicators
‍
Pricing
Bundle pricing
‍
FAQ
‍
Announcements
‍
COMPANY
‍
About
‍
In the News
‍
Testimonials
‍
Client Success Stories
CONTACT
‍
General Inquiries
‍
Media Inquiries
‍
Financial Professionals Inquiries
‍
© 2026 Sundial Capital Research Inc. All rights reserved.
Setsail Marketing
TermsPrivacyAffiliate Program
Risk Disclosure: The information and tools provided are for research and analytical purposes only and are not intended as investment advice. Market analysis involves uncertainty, and outcomes may differ from expectations. Users should conduct their own due diligence and consider their individual circumstances before making any financial decisions. Past performance is not necessarily indicative of future results.

Hypothetical Performance Disclosure: Hypothetical performance results have many inherent limitations, some of which are described below. No representation is being made that any account will or is likely to achieve profits or losses similar to those shown; in fact, there are frequently sharp differences between hypothetical performance results and the actual results subsequently achieved by any particular trading program. One of the limitations of hypothetical performance results is that they are generally prepared with the benefit of hindsight. In addition, hypothetical trading does not involve financial risk, and no hypothetical trading record can completely account for the impact of financial risk of actual trading. for example, the ability to withstand losses or to adhere to a particular trading program in spite of trading losses are material points which can also adversely affect actual trading results. There are numerous other factors related to the markets in general or to the implementation of any specific trading program which cannot be fully accounted for in the preparation of hypothetical performance results and all which can adversely affect trading results.

Testimonial Disclosure: Testimonials appearing on this website may not be representative of other clients or customers and is not a guarantee of future performance or success.