
Russell 2000 IWM ETF Reverse-Up Buy Signal

The Russell 2000 IWM ETF registered a reverse-up buy signal at the close of trading on 8/27/21. If you recall, the reverse-up concept identifies when an asset closes at a 1-month low and reverses higher to close at a 1-month high in less than ten trading days. If you're interested in reading the original concept note, please click here.
While I monitor the concept for alerts across a broad basket of securities, I closely watch a handful of cyclical industries that provide an important economic message. The small-caps are one of those groups.
We now have a signal from transports and small-caps in the last few weeks. Are the economically sensitive groups trying to tell us something?
Today's note aims to review the outlook for small-cap stocks after a reverse-up signal.
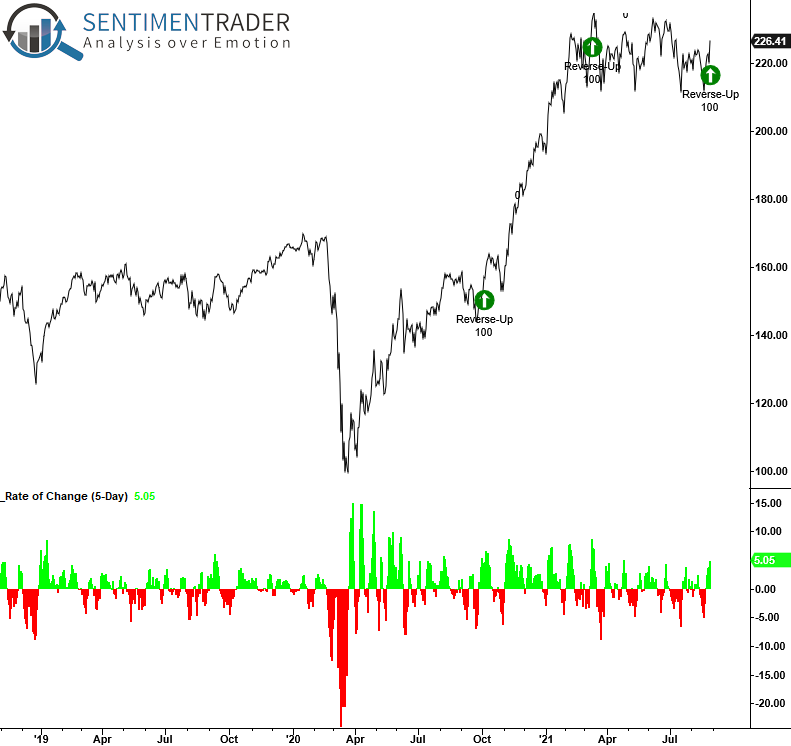
CURRENT DAY CHART - RUSSELL 2000 (IWM) ETF
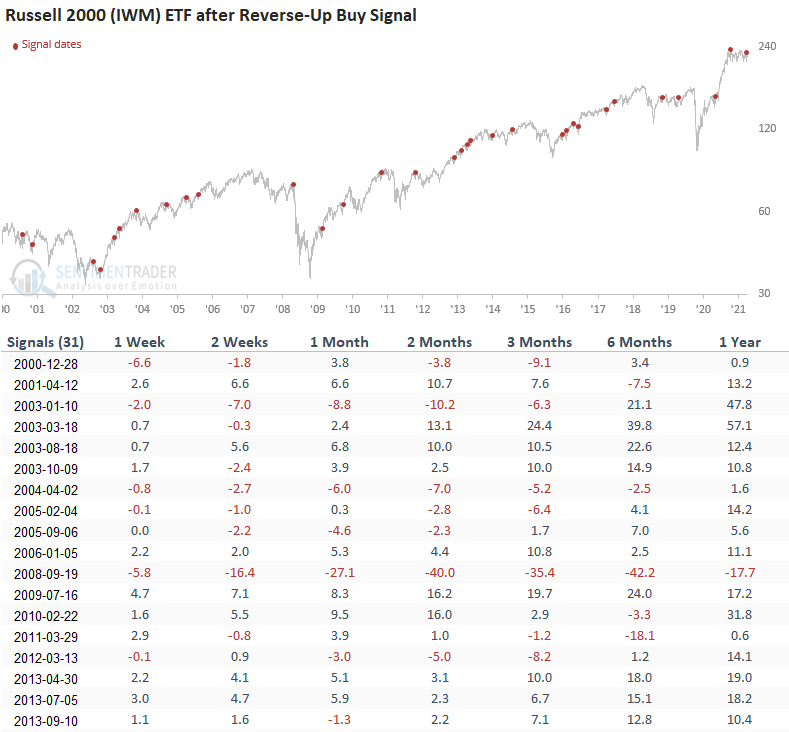
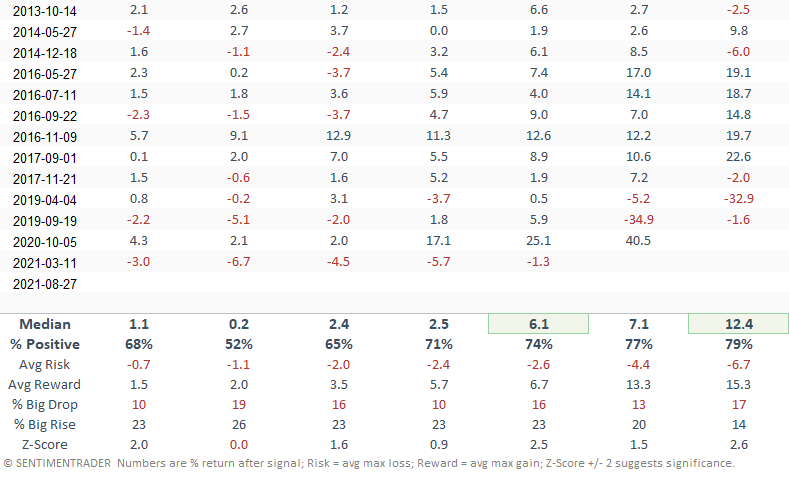
HOW THE SIGNALS PERFORMED
Results look good, especially the 3-month timeframe. I would also add that the 3-month timeframe registered 15 consecutive positive signals between 2013 and 2020.
The small caps have been in a trading range since March. So, does the recent reverse-up signal represent a short-covering rally from the bottom end of the trading range or the initial stages of a potential future breakout and new uptrend? The results would suggest the latter.