Sectors In Sync Makes Investors Crabby

This is an abridged version of our recent reports and notes. For immediate access with no obligation, sign up for a 30-day free trial now.
All up or all down
Half of the days so far this month have seen every major S&P 500 sector move up or down together. This makes it one of the most "all together" months since 1928.
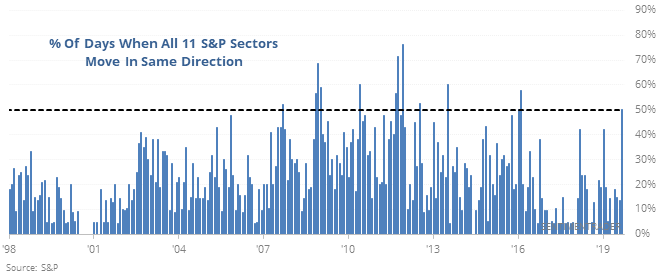
This kind of movement tends to unnerve investors, since it makes it seem like there is nowhere to hide from the volatility. That should especially be the case when stocks have recently been at a high or are close to one. But that hasn’t been the case, with the S&P showing a strong tendency to rise in the months following these signals.
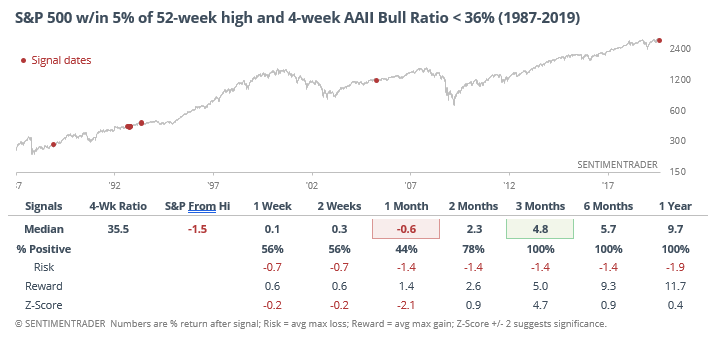
Still crabby
Investors in the AAII survey of individual investors have been fitting their profile of crabby old men. Despite what has been a relatively healthy market, they have “bah humbugged” all month, likely due to stocks’ whipsaws and head-scratching geopolitical events. For one of the few times in history, the Bull Ratio is exceedingly low while the S&P 500 remains within 5% of its peak.
Oh so close
The NYSE Advance/Decline Line has moved to within spitting distance of a new high for the first time in a month while the S&P 500 is still more than 3% below its own high.
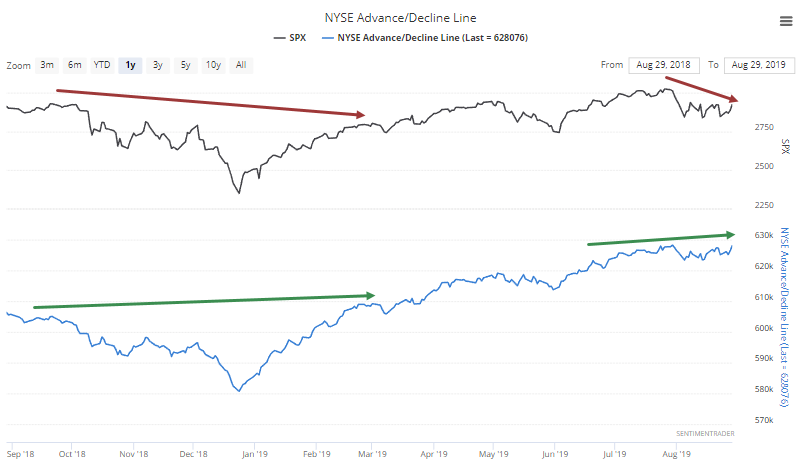
Of the 19 times this triggered since 1950, the S&P rose over the next 2 months 17 times (the two losses were minor, at -1.1% and -2.9%). It still took the S&P a median of 58 days before it was able to close at a fresh multi-year high.
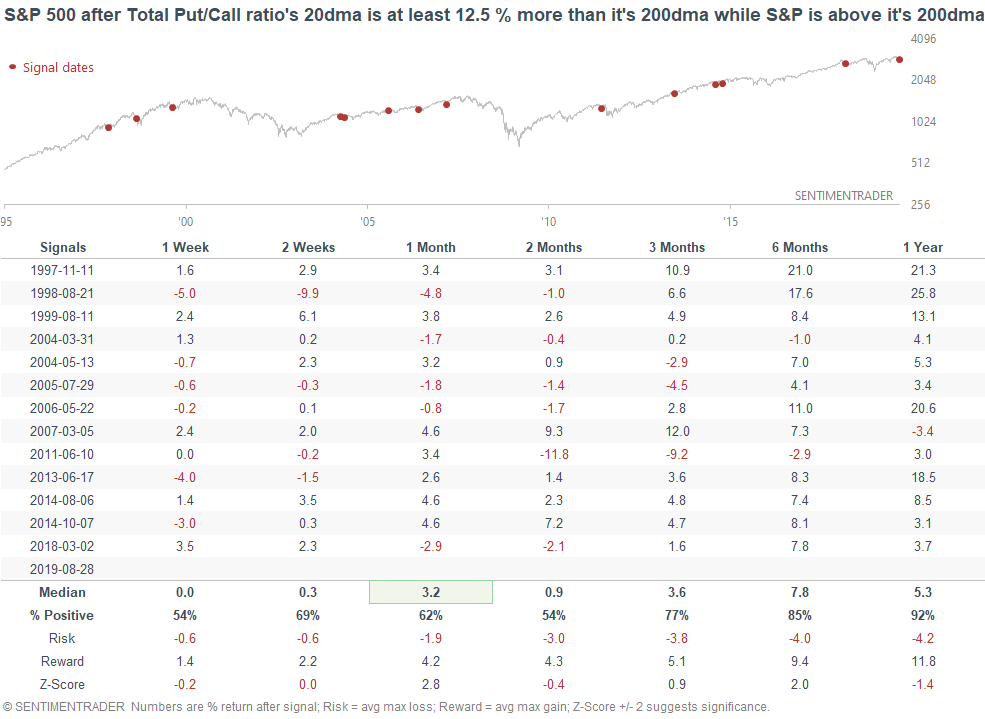
A lot of puts
The Total Put/Call Ratio’s 20-day average is more than 12.5% above its 200-day average, even while the S&P holds above its own 200-day. That has preceded gains in the S&P over the next year 12 out of 13 times, though short-term returns were below average.