Sharp drop from an all-time high
Thursday's drop was rare in the sense that it occurred immediately from an all-time high. Market movements since 2017 have become more and more one-directional, omitting many of the short term countertrend movements that were common from 2000-2017.
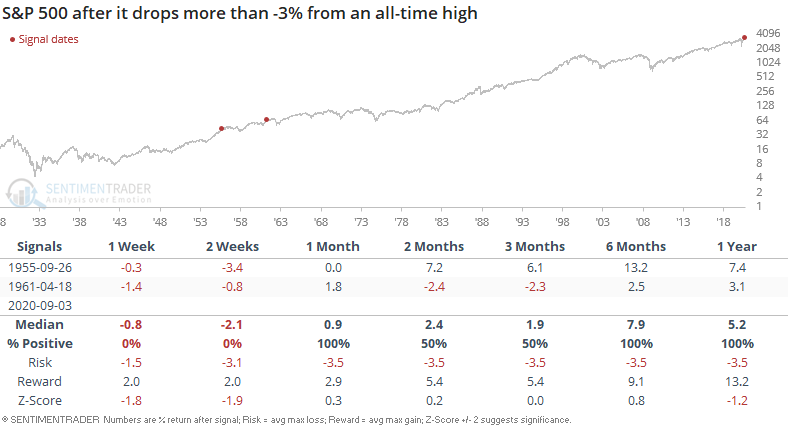
Aside from yesterday, there have been only 2 other historical cases in which the S&P dropped more than -3% in a single day from an all-time high:
We can loosen the study's parameters to increase the sample size. The following looks at historical cases in which the S&P dropped more than -3% from a 1 year high:
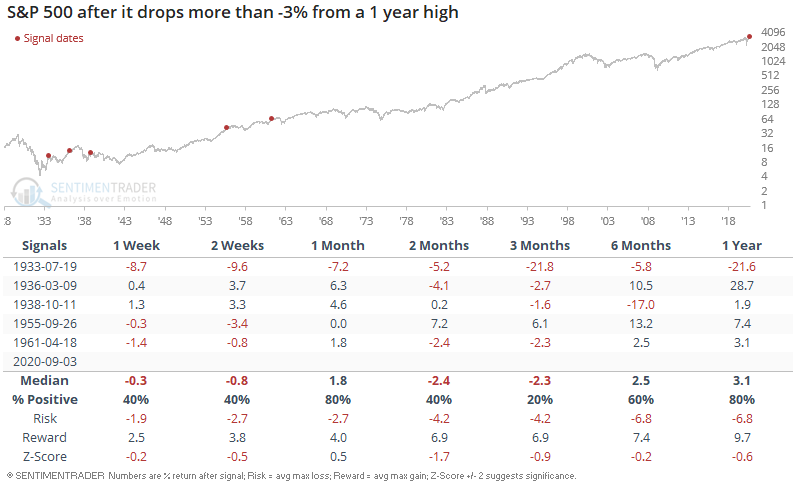
As you can see, these historical cases led to an extended pullback over the next few weeks and months:
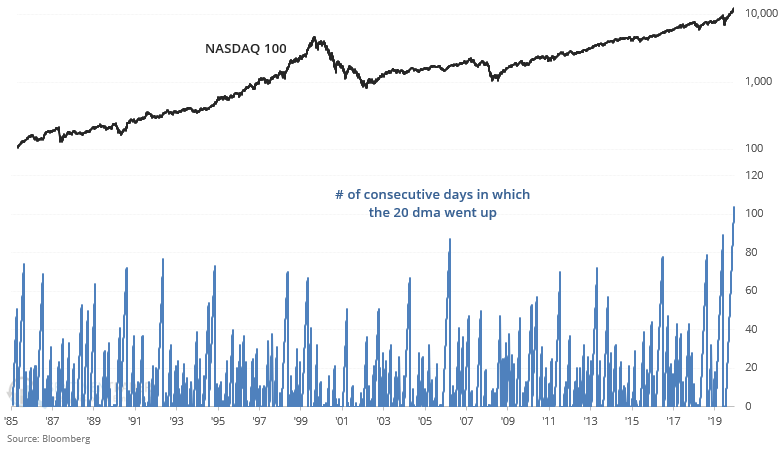
While it's tempting to think that this is *finally* the start of a pullback, it's hard to be certain without 20/20 hindsight. The NASDAQ 100 remains firmly above its 20 day moving average, which has acted as strong support throughout this entire rally. The most profitable traders over the past 2 years have generally been short term trend followers due to the market's price action (going straight up, going straight down, going straight up).
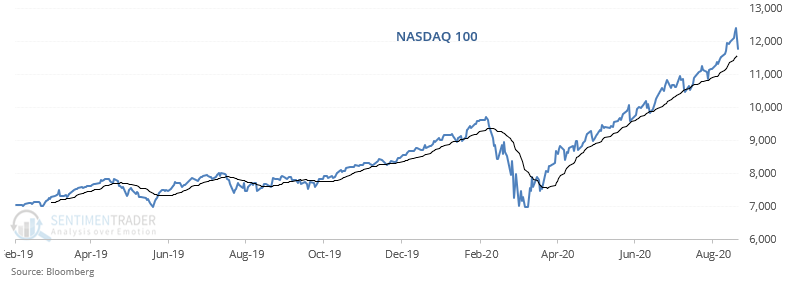
The # of consecutive days in which the NASDAQ 100's 20 dma went up is at a record:
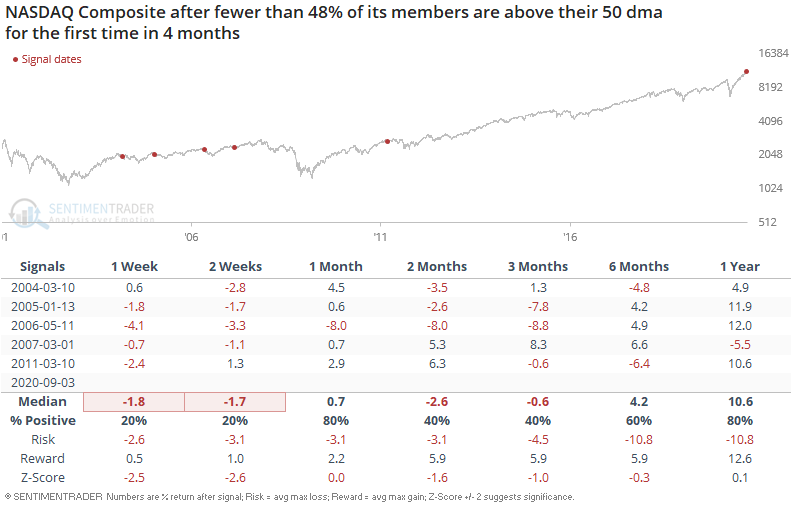
Meanwhile, the % of NASDAQ Composite members above their 50 dma has fallen to the lowest level in 4 months:
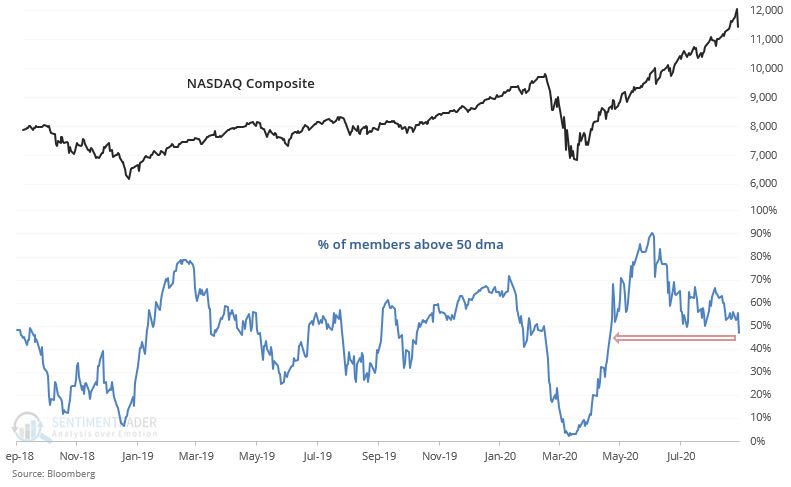
When this happened in the past, the NASDAQ Composite's pullback usually led to more losses over the next 1-2 weeks: