
Should we be concerned about the negative momentum in transportation stocks

Key points:
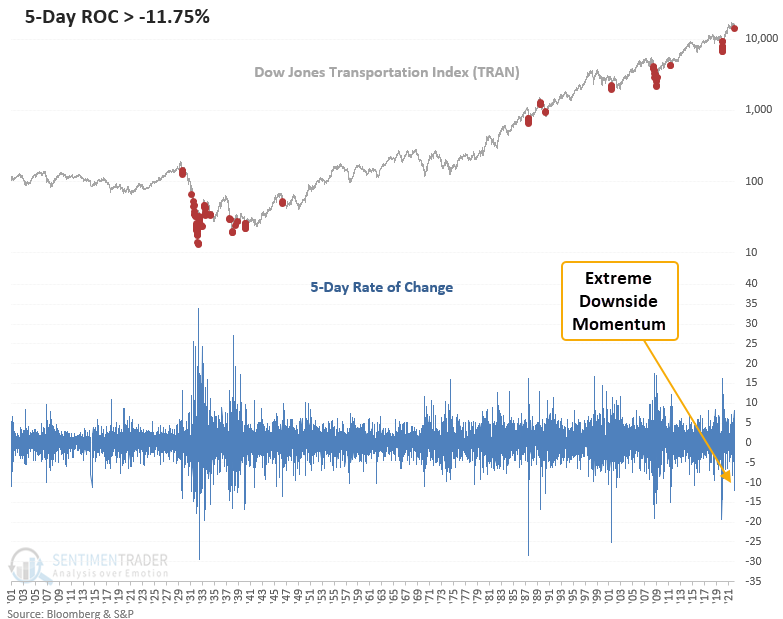
- A short-term gauge of price momentum shows a sharp contraction in transportation stocks
- The 5-day rate of change for the Dow Jones Transportation Index declined by almost 12%
- Similar momentum signals show unfavorable near term results for the transports
What happens when short-term price momentum accelerates to the downside
Let's conduct a study to assess the outlook for the Dow Jones Transporation Index and the broad market when the 5-day rate of change declines by more than 10%. To identify instances similar to the current environment, I will include a condition that requires the S&P 500 to be 4 months or fewer from a 2-year high. I will also use a reset above zero on the rate of change to screen out duplicates.
We haven't seen this type of downside momentum in transportation stocks since the pandemic crash in 2020.
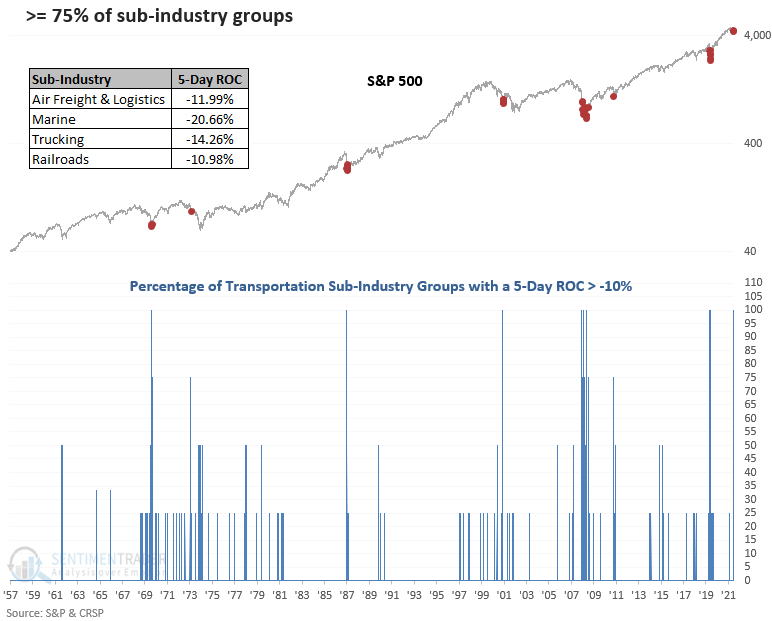
The downside momentum in transportation stocks is broad-based
When I checked the 5-day rate of change for the sub-industry groups within the transportation industry, it showed broad-based participation. For only the 6th time since 1969, the group count showed all 4 sub-industries down 10% or more on the same day. The marine sub-industry group had been a standout performer of late. However, it just suffered the fastest 20% decline in history.
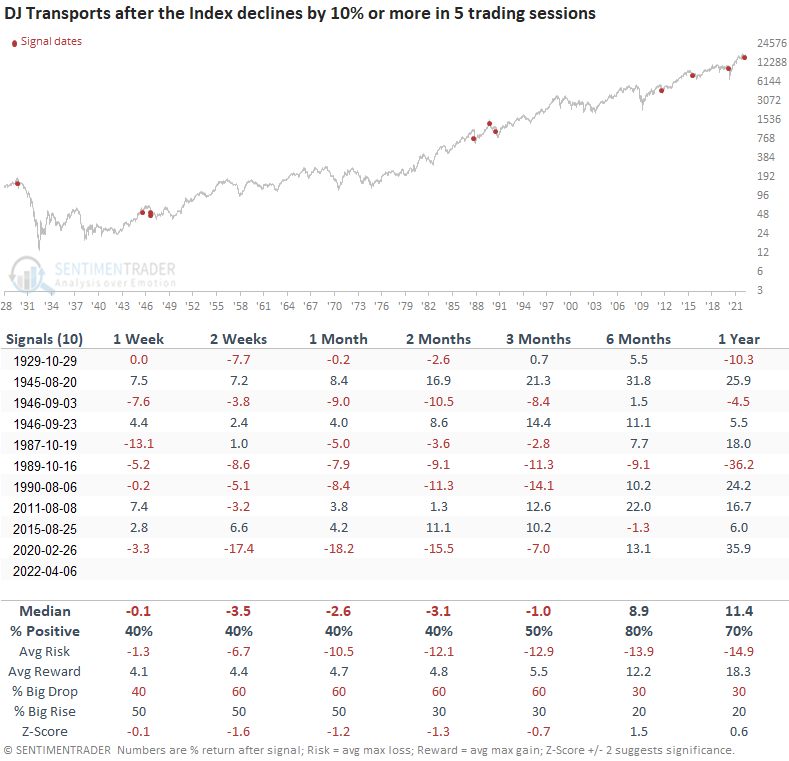
Similar episodes of negative momentum suggest weak near term results
This study generated a signal 10 other times over the past 93 years. After the others, the transportation Index showed unfavorable returns, win rates, and risk/reward profiles in the 1 to 13-week range. However, the 6-12-month windows look much better. Except for the 1945 signal, the transports recorded a lower close at some point in the next few months.
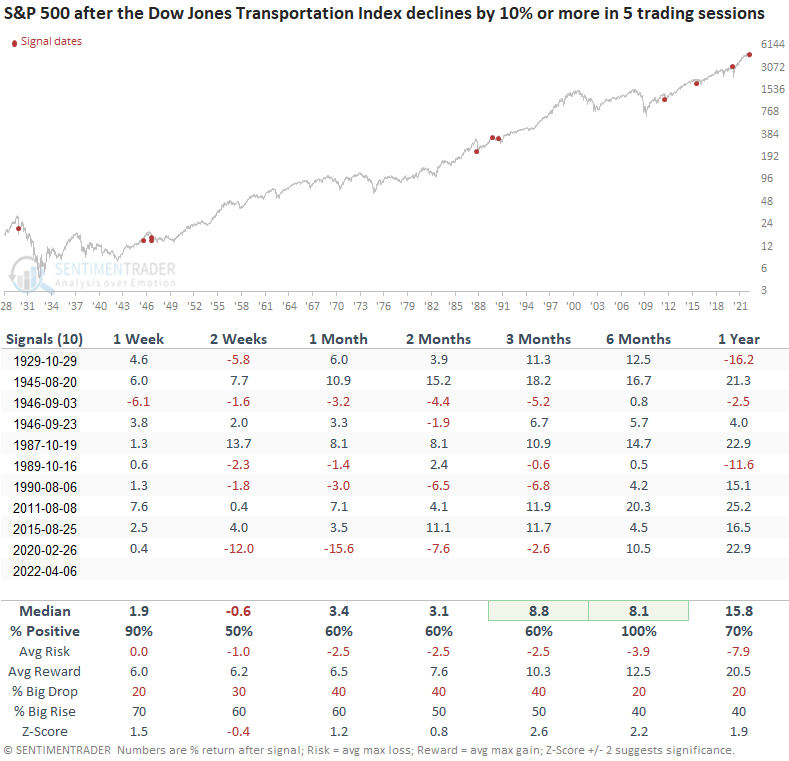
Do the transports foreshadow broad market weakness
When I apply the signals to the S&P 500, the results look much better across all time frames, especially the 6-month window. Since the GFC low in 2009, the transportation industry has experienced 3 cyclical slowdowns that have not resulted in a broad economic recession. The covid induced recession is debatable. So, we need to be careful about what the transportation industry might signal concerning the overall market or a potential recession.
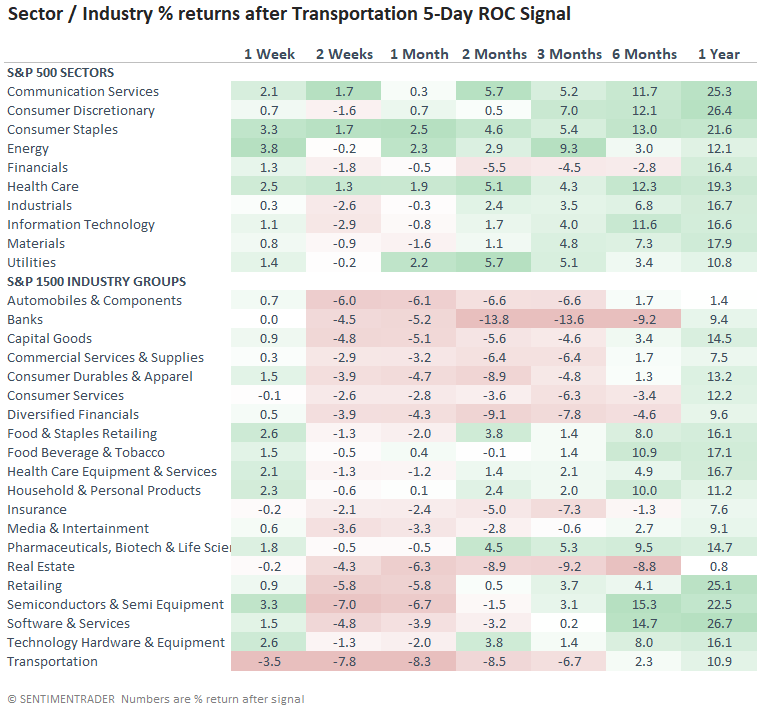
Sectors and industry groups suggest a cautious near term outlook
The performance table shows unfavorable results across the industry groups' 2-13 week time frames. Sectors don't look as bad, which could be a market capitalization difference. i.e., the industry groups contain small and medium-sized companies. Cyclical sectors and industries look much worse than defensive ones. The long-term results provide a brighter outlook.
Due to data limitations, returns reflect signals since 1987.
What the research tells us...
When the Dow Jones Transportation Index shows a massive downward shift in momentum, the adverse price action begets more adverse price action in the near term. However, we have to be careful about the message from transportation stocks as it is less impactful on the broad market. Similar signals to what we're seeing now have preceded unfavorable returns, win rates, and risk/reward profiles in the near term for the transports but better results for the S&P 500. A review of sectors and industry groups suggests we should be careful with exposure to cyclical stocks.