
Small-caps power broader surge

Out of all the major indexes, none are benefitting from the positive vaccine developments more than the Russell 2000 index of small-capitalization stocks. Despite a late-afternoon drop, they put in an impressive performance to start the week.
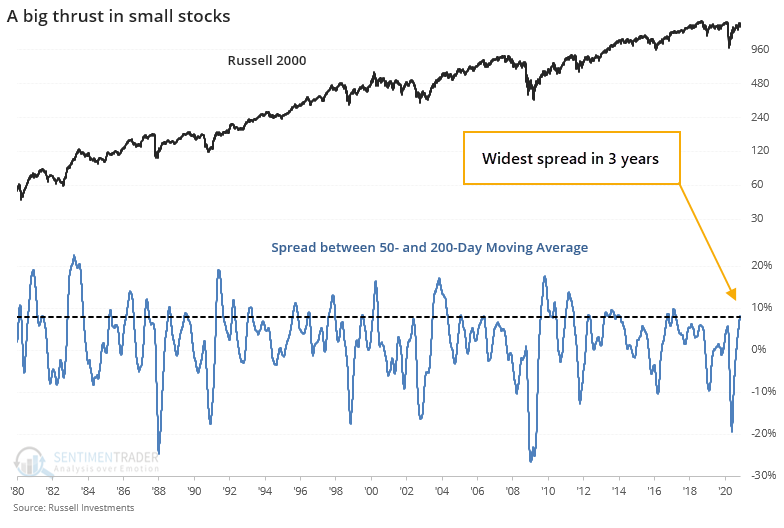
Even without Monday's massive rally, the Russell has performed well enough that its medium-term trend has jumped well above its long-term one, thanks to a kick-off surge in early October. Respected technician Helene Meisler noted that the 50-day average of the index has moved the most above its 200-day average since 2017.
While there have been wider spreads between the two trend measures, by the time it reached 8%, it has been a good sign for the index.

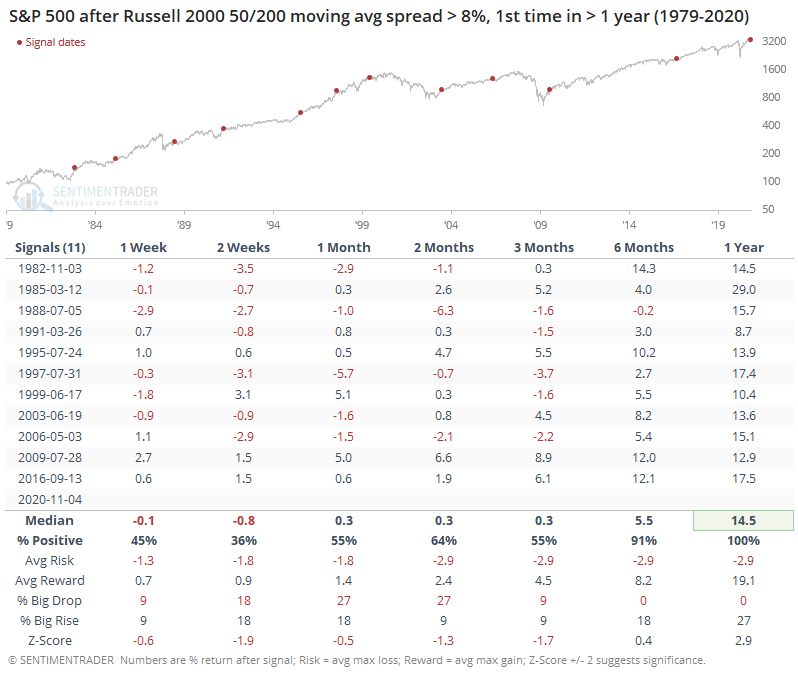
Returns were okay over the short- to medium-term but really shined over the next year. There were no losses out of the 11 signals, and the risk/reward was impressively skewed to the upside.
The good returns in small-caps reflected well on the broader market, too, after some short-term shakeout. Over the next 6-12 months, the S&P 500's performance was excellent.
Breadth figures on the NYSE are heavily influenced by small-cap stocks, so the jump in those stocks has helped trigger another round of extremely impressive breadth metrics. Last week, there was a cluster of breadth thrust signals and with Monday's addition, a Zweig Breadth Thrust was triggered.
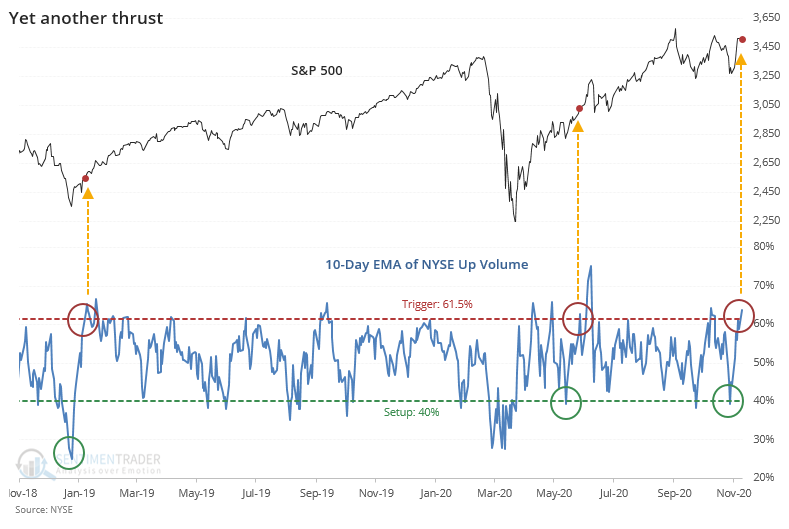
This has become a "go-to" signal that has generated a kind of mythology around it, unfortunately. We discussed this repeatedly in the spring, and why using very specific rules is a big mistake. It was again because it narrowly missed triggering several times even while we were clearly seeing impressive thrusts.
If we use the rules that we're supposed to, but using our preferred metric of volume instead of issues, then it did trigger on Monday. To do so, the 10-day exponential moving average of breadth has to cycle from below 40% to above 61.5% within 10 days.
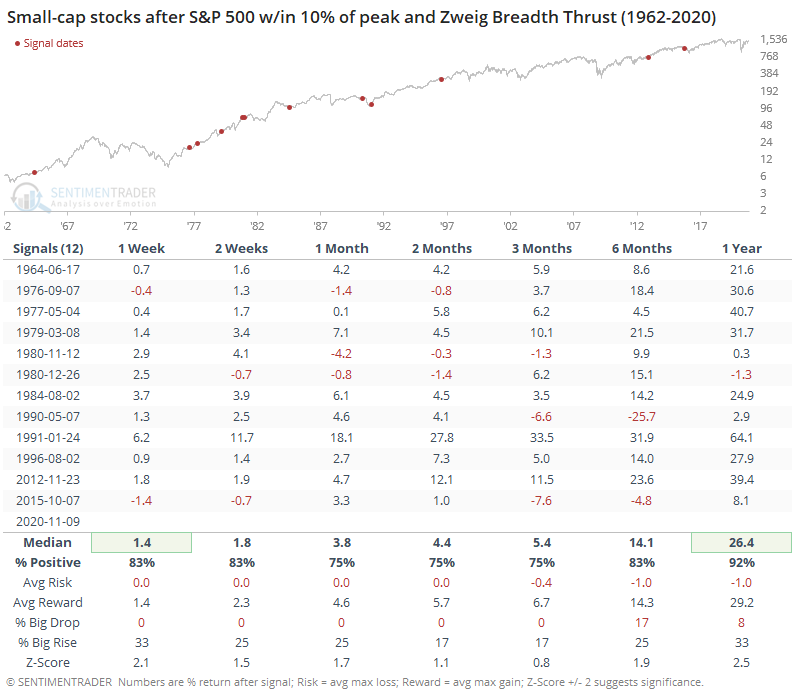
This kind of behavior is more typically seen after big declines, and not when stocks are at or near their highs. There have been a dozen that have happened when the S&P was within 10% of its peak.
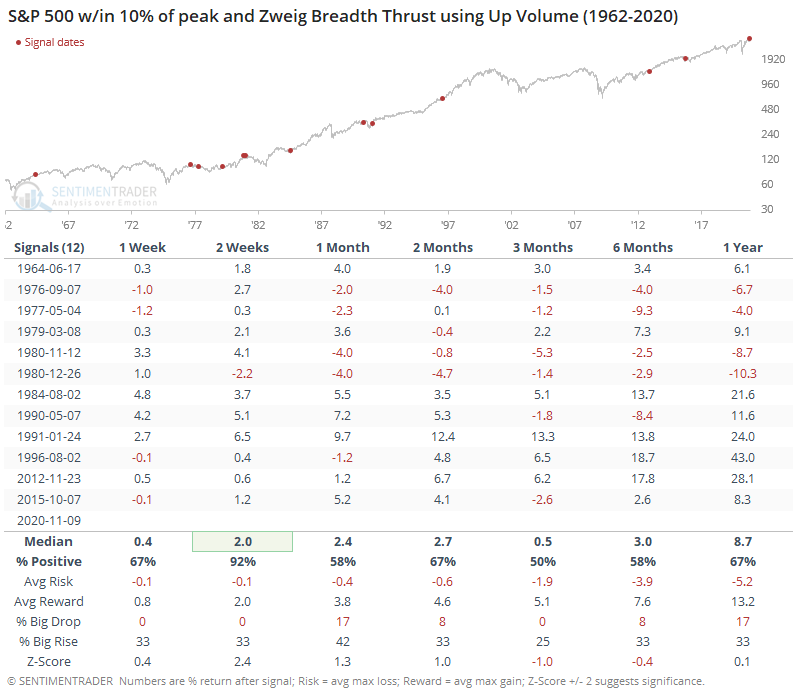
Over the next 2 weeks, the S&P continued higher all but one time, but the medium- to long-term returns less impressive.
It's interesting to note that after these signals, small-cap stocks performed significantly better than did the S&P. The risk/reward over the following 6-12 months was remarkably skewed to the upside.
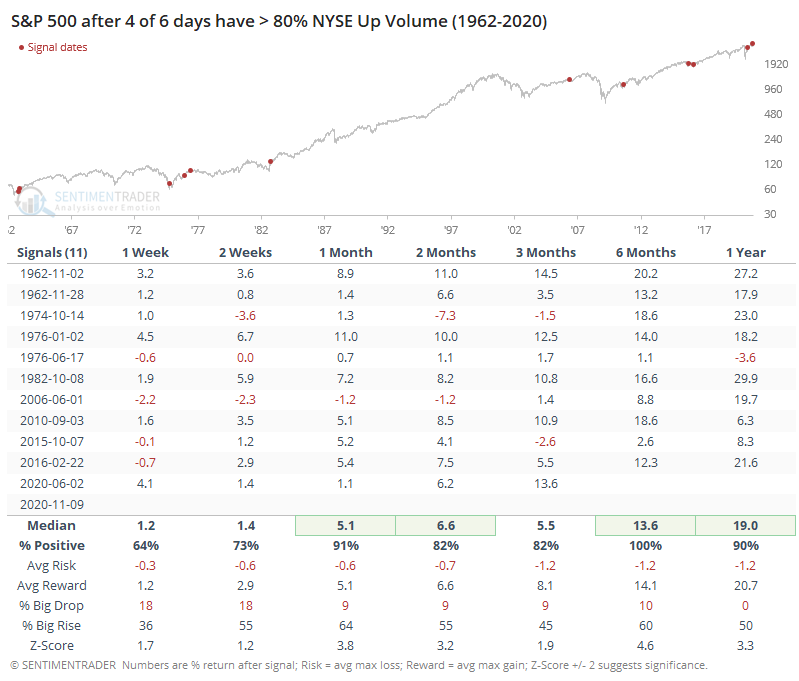
As we saw last week, 3 out of 4 sessions had seen overwhelming buying interest, with more than 80% of volume flowing into advancing issues. Monday added to that tally and made it 4 out of 6 sessions. That's never failed to lead to higher prices over the next 6 months.
Sticking with the small-cap theme, those stocks tended to enjoy even better returns.
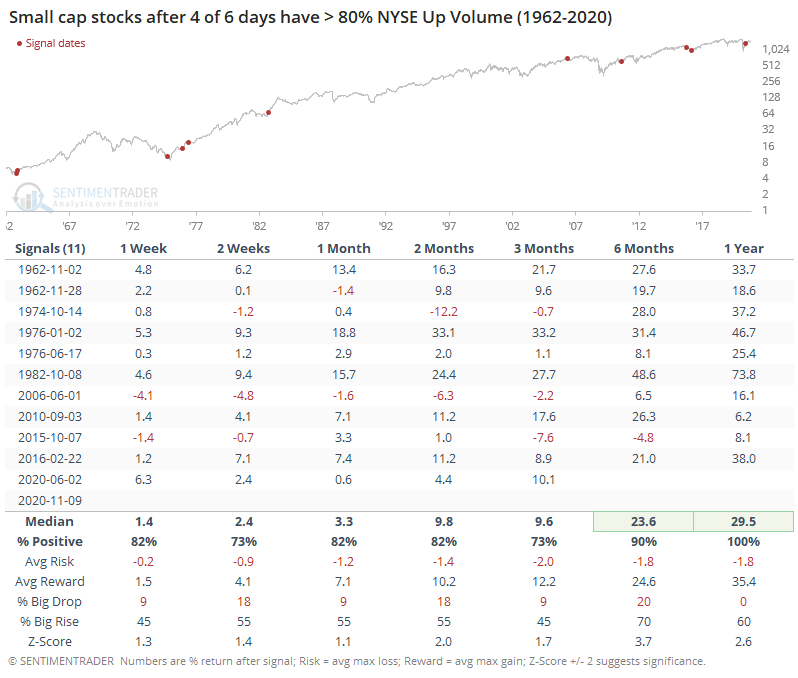
Like we saw in October, short-term bursts like stocks have enjoyed over the past week aren't a very reliable signal for short-term traders to jump on board, as there is often a pullback as gains get digested. But the kind of intense buying interest demonstrated on multiple occasions since last week has a very good record at preceding further gains over a medium- to long-term time frame.