
Sometimes the Middle is Not a Bad Place to Be

This is part 1 of a 3-part series
Certain rivalries in the financial markets sort of take on a life of their own: stocks vs. bonds, bold vs. silver, growth versus value and of course large-cap vs. small-cap.
Large vs. small is one that a lot of investors pay close attention to, and understandably so. It is sort of the David vs. Goliath of the stock market. Some investors look to large-cap stocks as a known quantity – big, established companies who generally speaking, can be relied upon to generate steady, if not spectacular growth. Others are pulled toward small-cap stocks, often in hopes of finding the "next Apple" or Microsoft, etc. And in the midst of this never-ending debate, smack dab in the middle lies a potentially significant opportunity that many investors rarely if ever consider – the mid-cap space.
I am fond of saying that success in the markets typically comes from finding an edge and then exploiting it. While the majority analyze large and small caps with a fine-tooth comb, a much smaller slice of the investment population ever gives mid-caps much consideration as an asset class.
Is this a mistake? I'll show you the numbers and you decide.
Mid vs. Large vs. Small
The S&P 400 MidCap Index was first calculated in January 1981, so we will test from January 1981 through December 2020, a period of fully 40 years. We will use total monthly return data for the following indexes as a proxy for each asset class:
- Mid-cap: S&P 400 MidCap Index
- Large-cap: S&P 500 Index
- Small-cap: Russell 2000 Index
Our first test involves simply buying and holding each index over the fully 40-year period. The chart below displays the cumulative % +(-) for each index from 1981 through 2020.
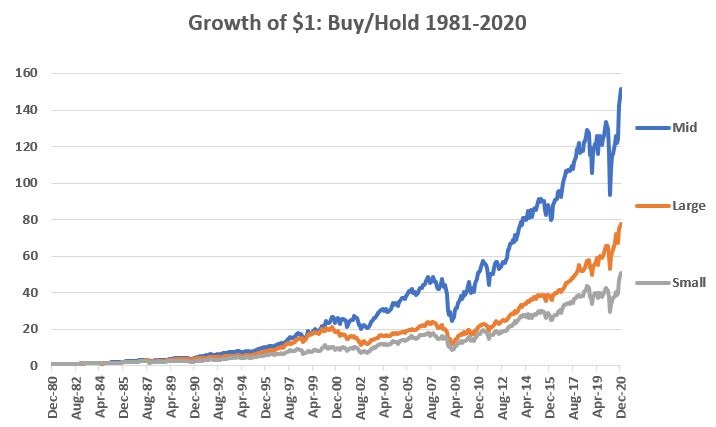
The 1981-2020 buy-and-hold returns appear in numerical form below.
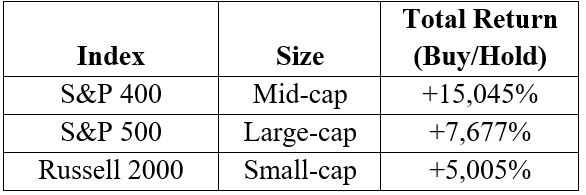
There is little question as to which index performed the best overall on a buy-and-hold basis over the past 40 years. But there are two key questions to consider:
- Why did Mid-caps outperform by such a wide margin?
- Is there some sort of permanent advantage associated with Mid-caps?
Regarding "why" Mid-caps outperformed, I have a theory. It goes like this: The Mid-cap space is comprised of formerly Small-cap stocks on their way to becoming Large-cap stocks, i.e., the Mid-cap space is where the "growth" happens. Now obviously this is a broad generalization and does not apply specifically to every stock in the Mid-cap space (since some are probably formerly Large-cap stocks on their way to becoming Small-cap stocks). But overall the theory make sense, if true, would neatly explain the significant overall outperformance.
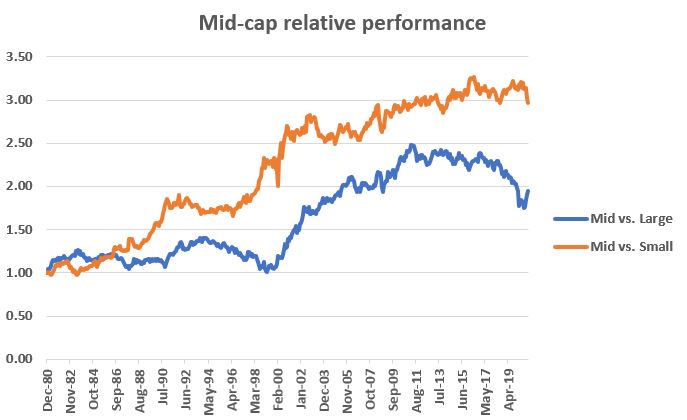
Regarding the likelihood that Mid-caps will continue to be the top-performing sector long-term going forward, that is very much an open question. If the theory above holds water then as long as there is overall economic growth, Mid-caps would seem to have a better than even chance to continue to perform well. However, as you well know, there is a constant ebb-and-flow to all things in the market. Results that look at a specific 40-year period are merely a "snapshot" in time. To get a better sense of how Mid-caps perform relative to the other indexes over time, let's compare the growth of Mid-caps to the growth of the other indexes over time. In the chart below:
- The blue line represents the cumulative performance of Mid-caps versus the cumulative performance of Large-caps
- The orange line represents the cumulative performance of Mid-caps versus the cumulative performance of Small-caps
When a line is rising it means Mid-Caps are outperforming the other index and vice versa. As you can see, there is a definite ebb-and-flow between Mid-caps and large-caps (blue line). On the other hand, Mid-caps have tended to trend mostly higher – with occasional sideways periods – relative to Small-caps (orange line).
Let's focus for a moment on Mid-caps versus Large-caps. The chart below displays the rolling 5-year return for Mid-caps minus the rolling 5-year return for Large-caps. When the value is positive it means Mid-caps outperformed over the most recent 5 years and vice-versa.
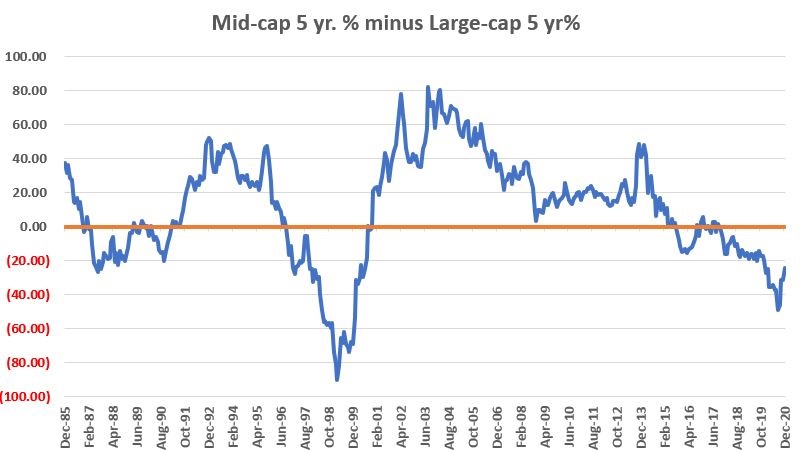
Here we see a definite tendency for one index to significantly outperform on a buy-and-hold basis for a period of time and then for things to reverse. We can see that:
- Previous dips into deeply negative territory (i.e., periods where Large-caps significantly outperformed over a 5-year period) were followed by periods of significant outperformance on the part of Mid-caps
- The current value is deeply negative but has reverse sharply in recent months
One knee-jerk reaction might be to assume that Mid-caps are once again ready to reassert themselves and outperform over the next several years. However, this is mere speculation and there is no guarantee that that is what will happen next.
In order to assess the possibilities, in Part II we will dig a little deeper into the Mid-cap space.