S&P 400 Midcap Index Breadth Update

In several intraday updates in the last few weeks, I've noted the deterioration in a breadth composite for the S&P 500. The short-term measures are influencing the composite as long-duration indicators remain healthy. Today's note aims to review Midcap breadth as the internal condition for the index looks weak compared to the S&P 500 and 600.
For those not familiar, the S&P indexes include the 400 (Mid-Caps), 600 (Small-Caps), and 500 (Large-Caps).
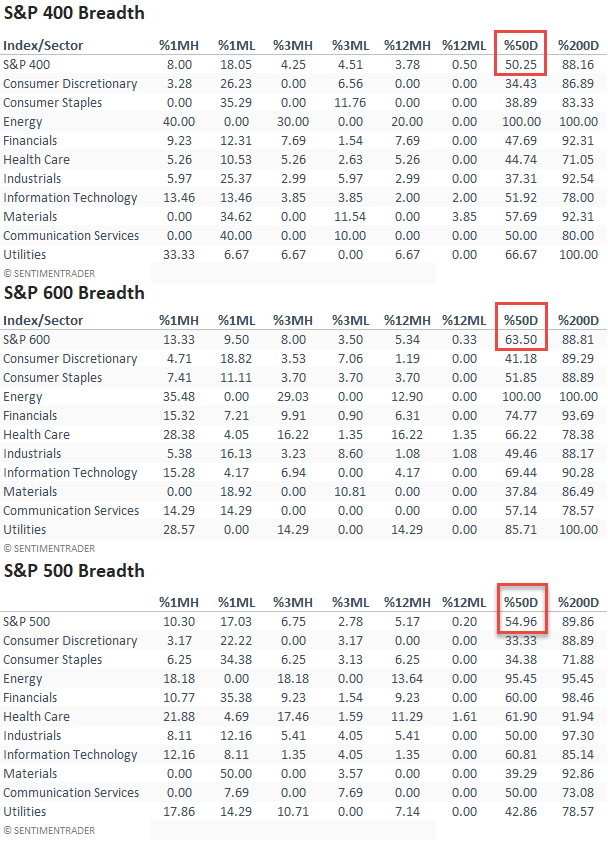
BREADTH COMPARISON TABLE
As the table shows, several short to intermediate-term breadth indicators like 1 & 3-month lows and the percentage of members above the 50-day moving average are weak for the S&P 400. I would also add that the S&P 500 measures are soft. It would appear that the S&P 600 is the best of the bunch, although it's not exactly stellar.
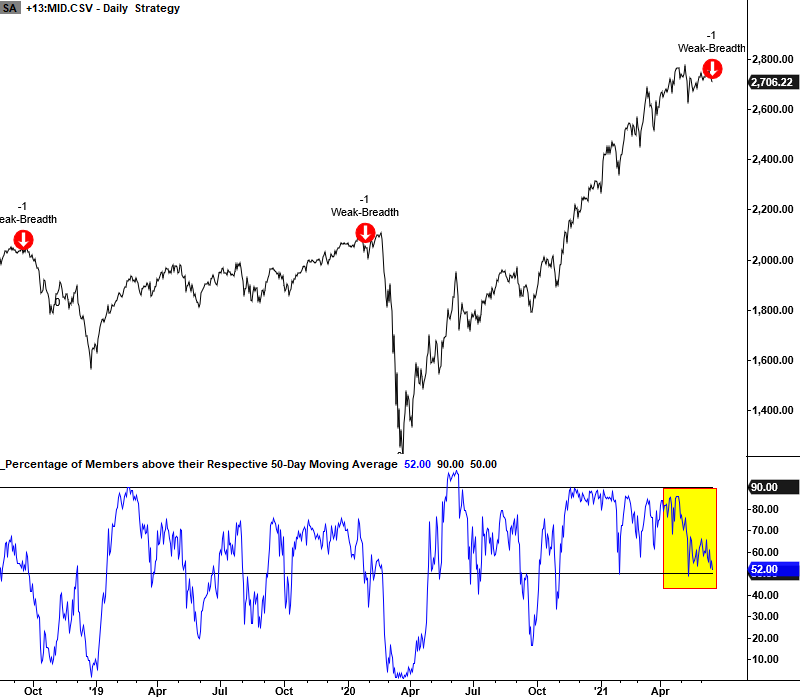
Given the weak percentage of members trading above their respective 50-day moving average, let's conducts a study to assess forward returns when conditions are similar to the current parameters. We will search for all instances when the percentage of S&P 400 members trading above the 50-day is less than 52.5%, and the index is within 2.5% of its most recent high. Repeats are screened out by a days-in-trade holding period of 35 days.
Suppose you're wondering why the data in the table and the chart do not match. That's because two different vendors calculated it. The chart version is the official SentimenTrader.com value.
CURRENT DAY CHART
Please remember the following analysis is a study and not a risk-off model that I use in the TCTM.
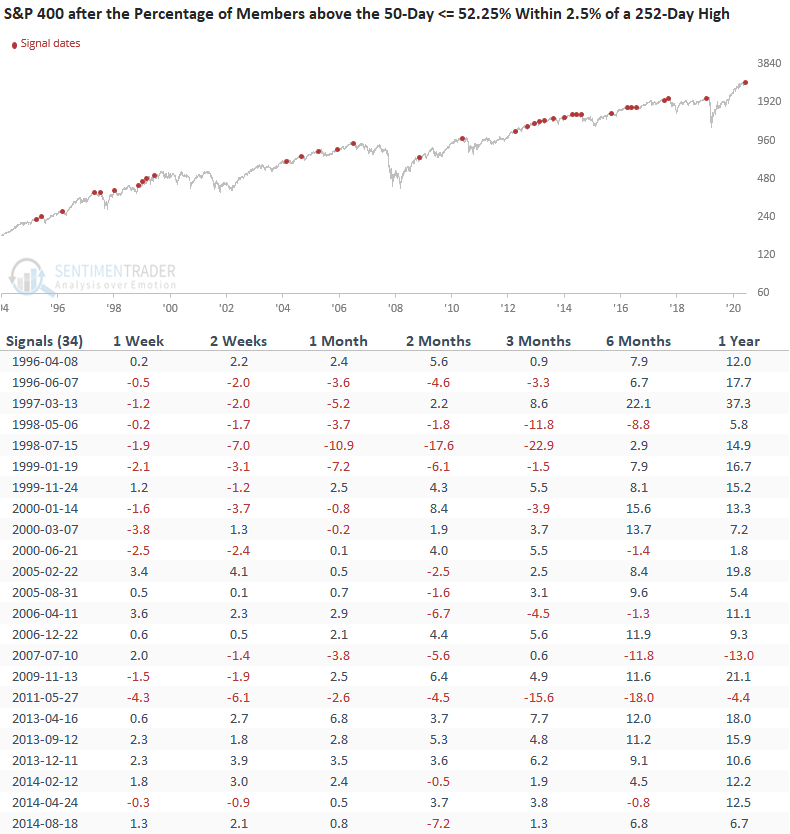
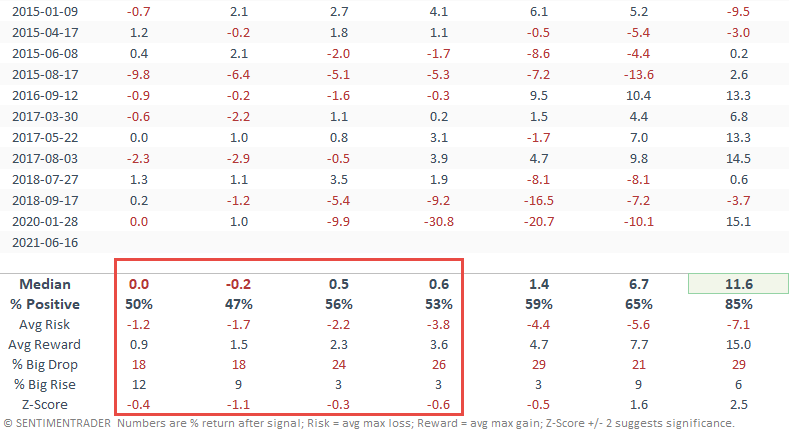
HOW THE SIGNALS PERFORMED
Performance looks weak, especially in the first three months. The results would suggest that the current consolidation continues for the foreseeable future. Interestingly, the 1-year results look promising.
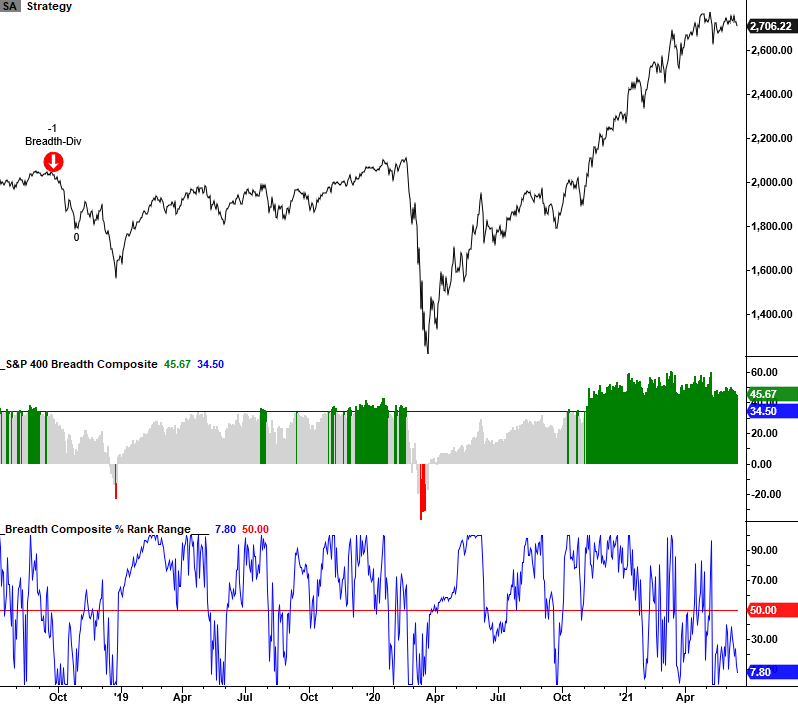
S&P 400 BREADTH COMPOSITE DIVERGENCE MODEL
The following chart contains my breadth composite model for identifying a divergence risk-off signal. The composite contains long-duration indicators. While the composite has deteriorated of late, it remains well below the signal threshold level of 34.5%. I will be monitoring closely.
Please click on the following link for a note with details on how the model works. Click here.