
S&P 500 Equal-Weight Index Momentum

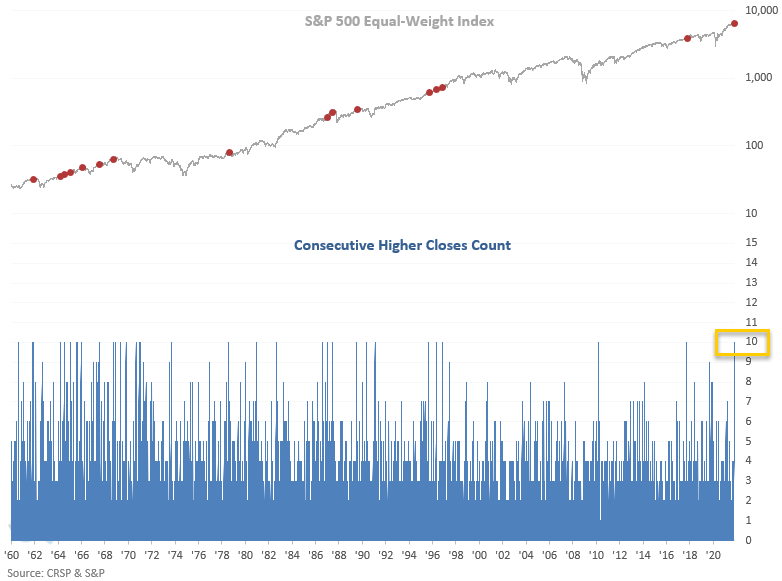
On Monday, the S&P 500 equal-weighted index closed higher for the 10th consecutive day. And, the index simultaneously closed at a record high.
As a reminder, the version of the S&P 500 that weights all 505 member stocks equally provides a better picture of stock participation than the version which weights the members based on their market capitalization.
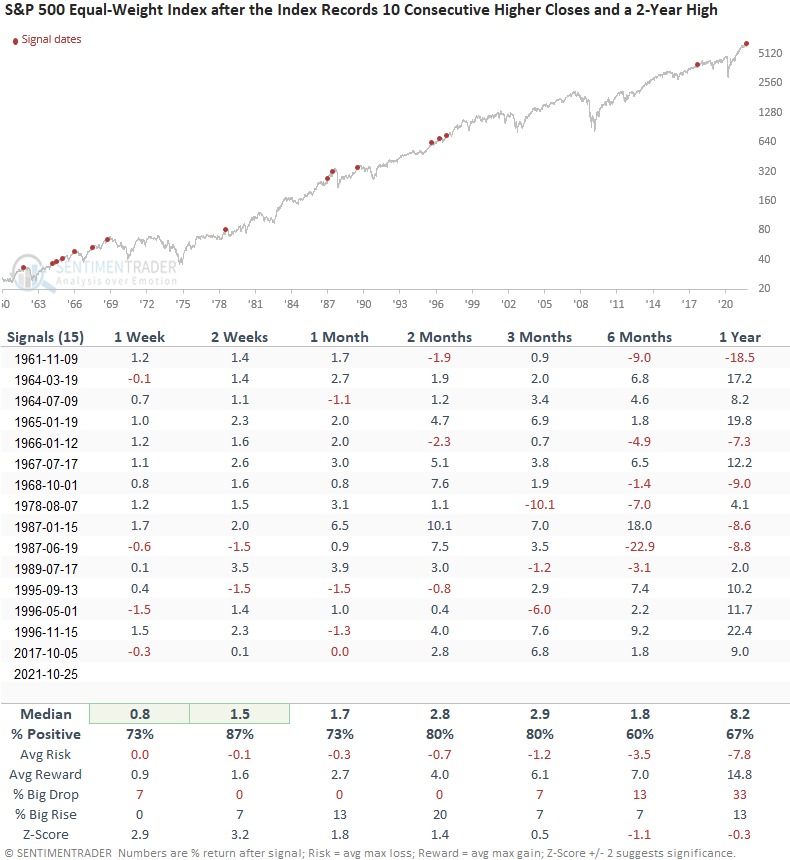
Let's conduct a study to assess the outlook for the large-cap stocks when the equal-weighted version of the S&P 500 records ten consecutive higher closes and simultaneously closes at a 2-year high. I used a 2-year high versus an all-time high to capture more instances.
HISTORICAL CHART
Interestingly, historical instances of ten consecutive higher closes were much more prevalent until the late 1990s. I wonder if technology's dominance on cap-weighted indexes like the S&P 500 has something to do with the change in character.
The dots on the chart reflect signal dates for the study, not all instances
HOW THE SIGNALS PERFORMED
Results look good on a short to intermediate-term basis, especially in the first couple of weeks. So, even though momentum has been strong lately, the study results suggest that it can continue.
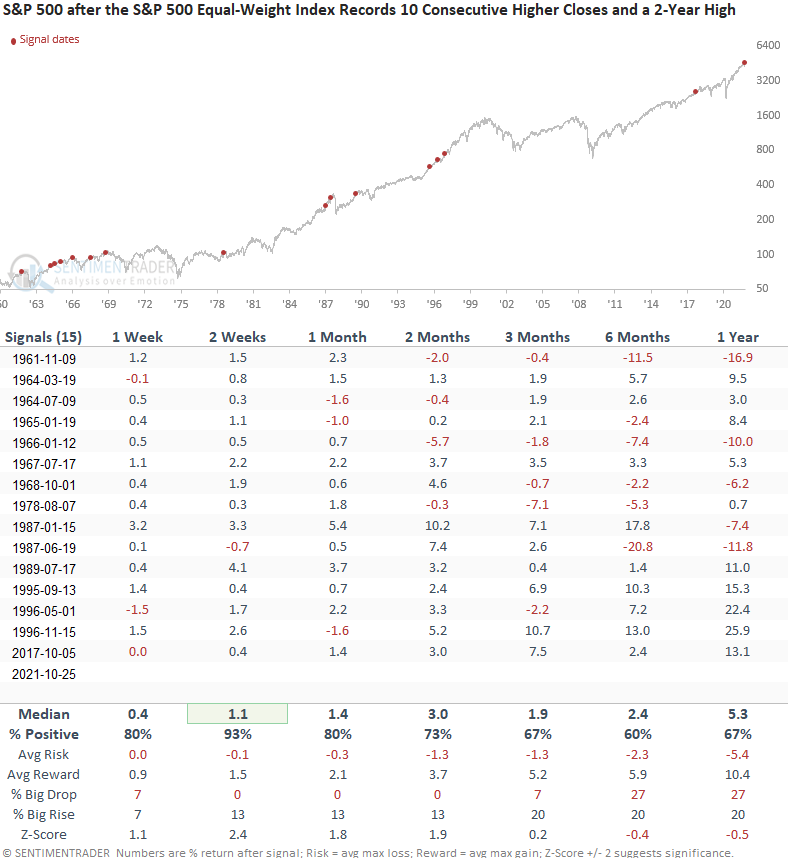
Given the amount of money invested in S&P 500 Index Funds and ETFs, let's apply the equal-weight signals to the cap-weighted S&P 500 index to assess the outlook for the most widely followed benchmark.
HOW THE SIGNALS PERFORMED
Once again, we see good results on a short to intermediate-term basis, especially in the first couple of weeks.
Market participation as measured by the S&P 500 equal-weighted index has been strong of late. Based on today's study results, the momentum can continue.