
S&P fully recovers from its long-term deviation

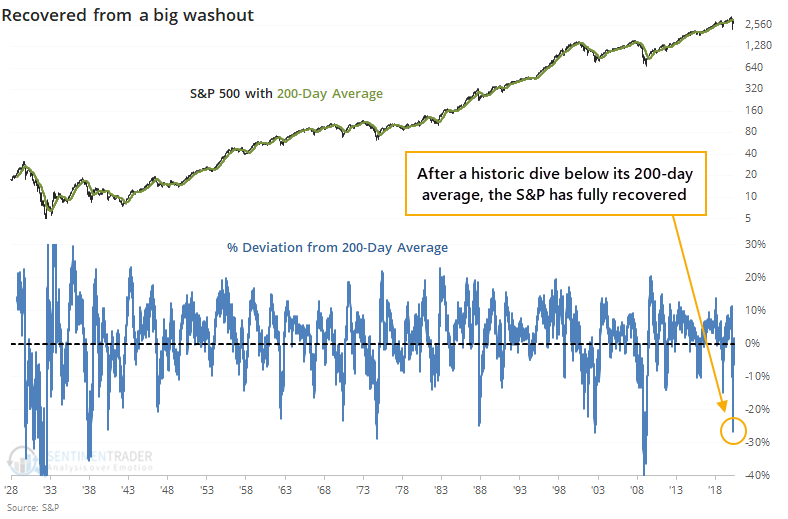
In what almost seems like no time at all, the S&P 500 has recovered above its 200-day moving average. That's quite a feat considering it was more than 25% below its average in March, one of its worst deviations from trend ever.
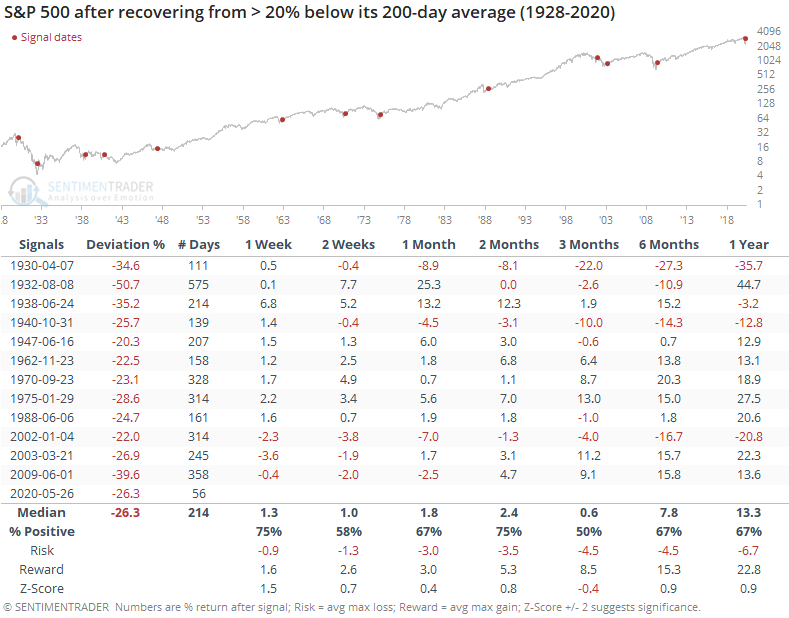
What's truly remarkable is how quickly it's gone. On average, it has taken the S&P more than 200 days to close above its average after falling more than 20% below it. This time, it took a mere 56 sessions. That is - by far - a record turnaround. No other instance even comes close. What's even more astounding is that these quick 56 days included a month when it was stuck just below the 200-day.
If we focus only on the fastest turnarounds, the ones that took fewer than 214 days to recover, then the future returns looked like the following.
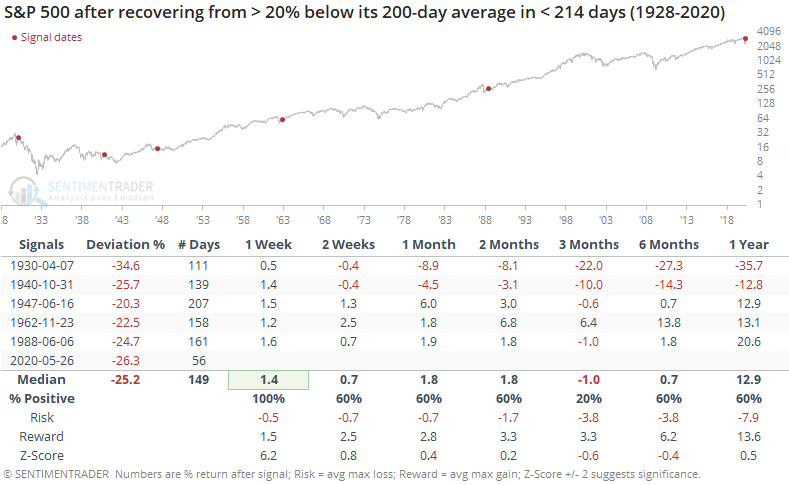
The recovery in 1962 took about three times as long as the current one, but it was a good sign as stocks continued to add to their gains in the months ahead.
The others, not so much. Once the S&P moved back above its average, it continued to rally for the next week, then started to fall apart in several cases. Only that one from 1962 still showed a gain after three months. It's a good sign that the S&P is back above its average, but we shouldn't necessarily count on it remaining above. As long as it does, great. If it fails, then it has some precedents that really struggled afterward.