
S&P's technical sell signal lacks punch

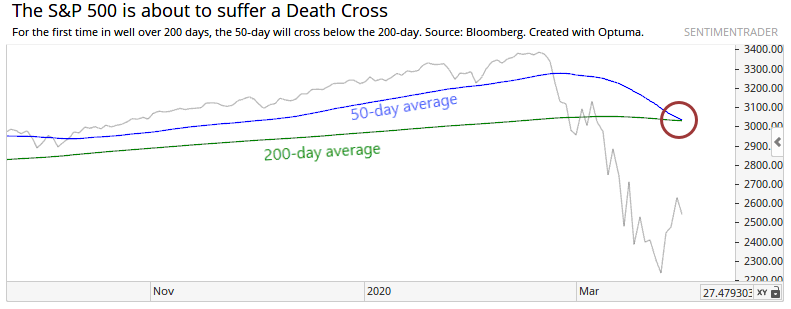
The most benchmarked index in the world has suffered a technical sell signal.
For the first time in well over a year, the S&P 500 is seeing its 50-day moving average cross below its 200-day average. The Death Cross tends to get quite a bit of attention, even though its record is spotty. Back in September 2015, we looked at what happened when all four major indexes succumbed to this sell signal, and results were not exactly negative.
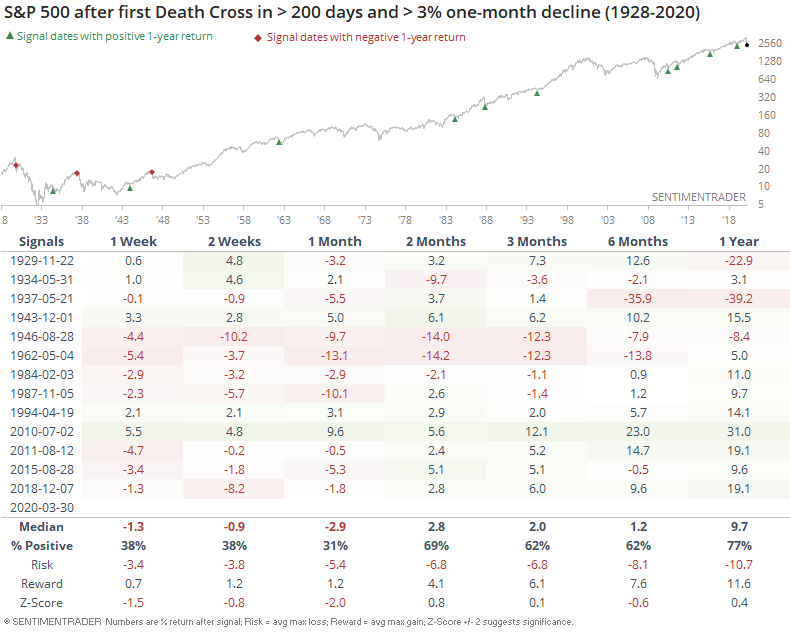
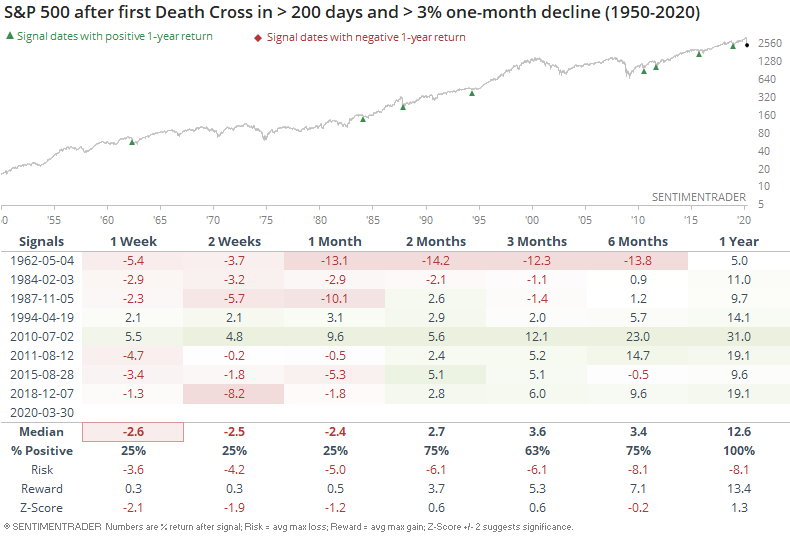
Sometimes the crosses occur in rapid succession, but this one is happening after the averages were positive for at least 200 days. This one is also a bit different in that it was triggered by a severe, quick decline. If we restrict our study to those crosses that were precipitated by the worst one-month declines, then we can narrow down the field to those most similar to the current one.
Since 1950, longer-term returns improved dramatically.
There was consistently some weakness in the short-term as traders digested the volatility, but then stocks quickly worked higher. Below, we can see the price path in the S&P from 30 days before the signal to 252 days after.
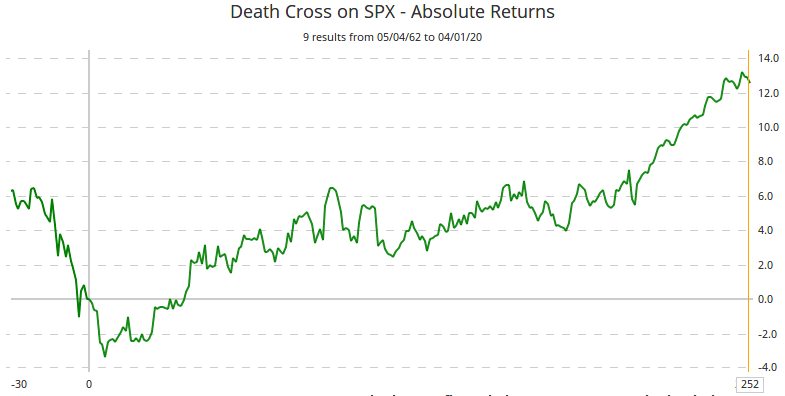
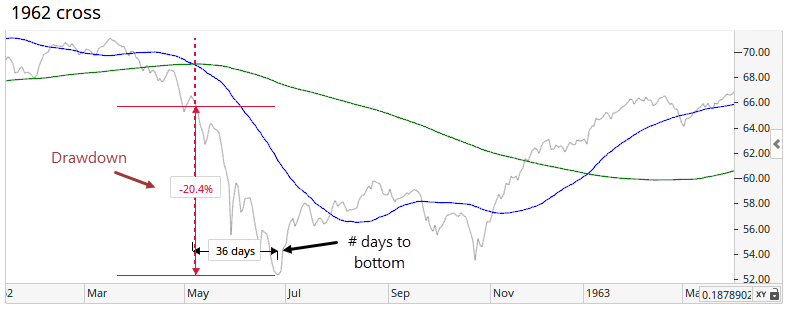
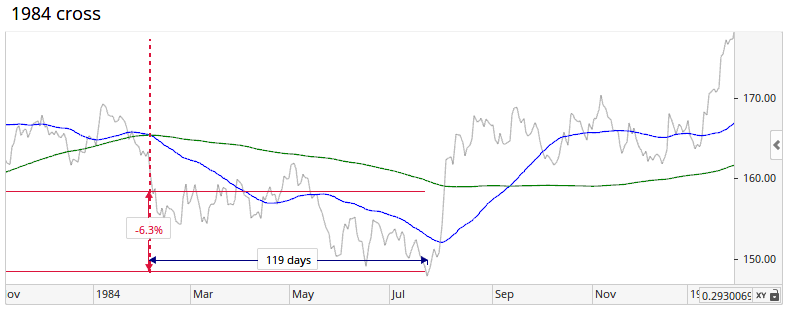
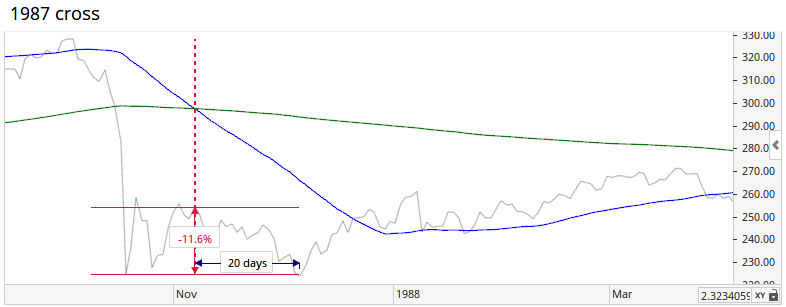
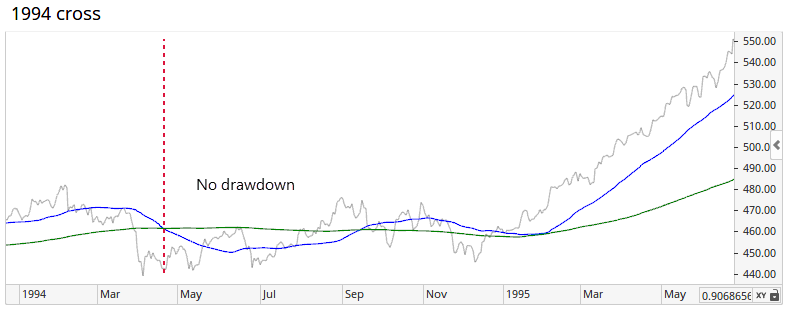
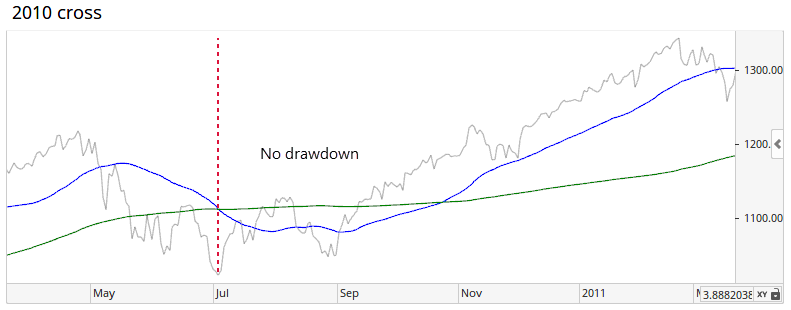
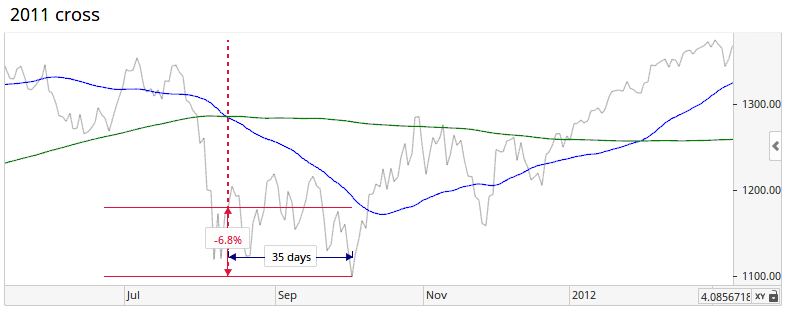
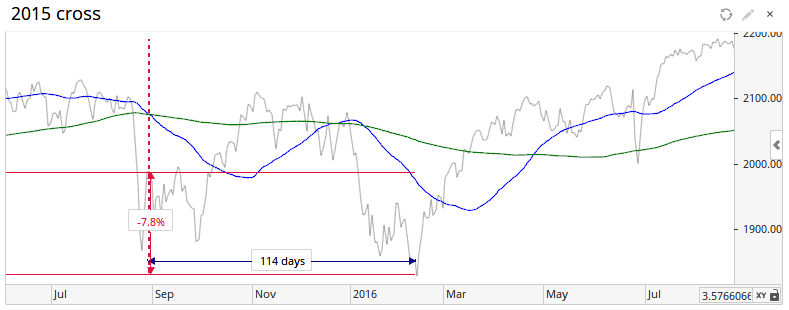
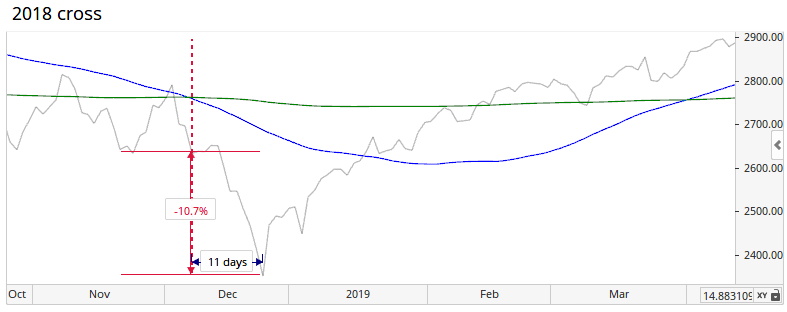
Below, we can see the individual instances and how long it took to bottom, as well as the risk to get there.
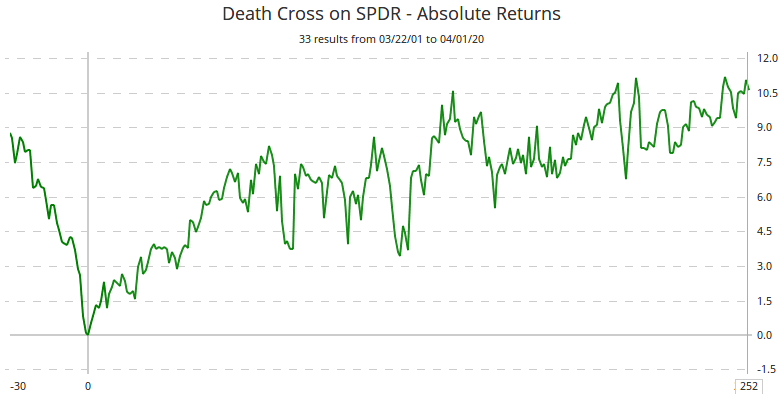
This isn't just a phenomenon in the S&P 500, either. Using the major sector SPDRs, it's the same general pattern, with even less of a tendency for short-term weakness. Below, we can see the average price path in the sector SPDRs after the first Death Cross in at least 200 days, and that were triggered by heavy losses over the past month.
Looking at all current stocks in the S&P 500, there have been over 1,800 of these signals over the past 50 years. The distribution of forward returns is very positive.
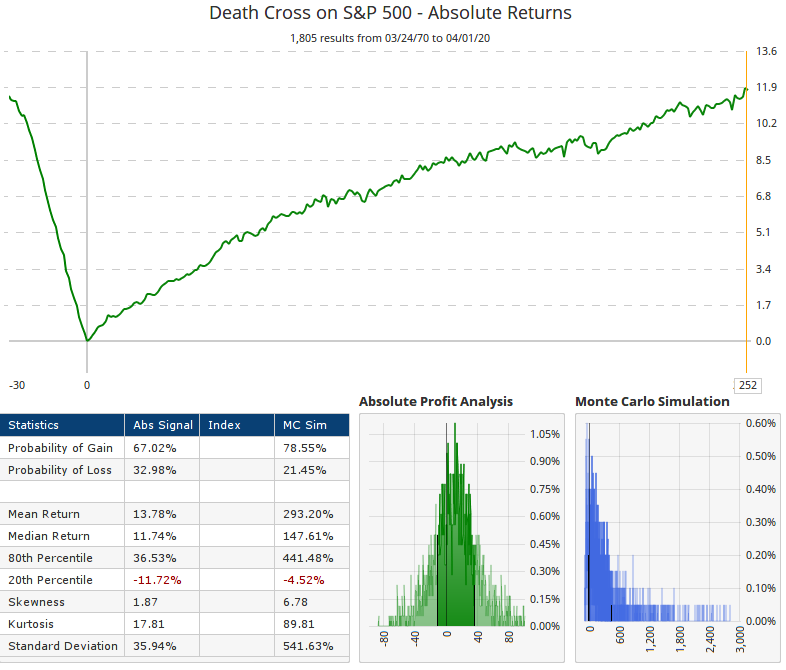
The returns across stocks, sectors, and the S&P 500 index itself suggest that this is not a robust sell signal. If anything, it's the opposite over a medium- to long-term time frame. The only caveat is that quite a few of the recent signals saw a testing phase of the initial low, though that has become such consensus opinion right now, it seems unlikely for the market to accommodate so many similar opinions.