
SPY stretches far above its average traded value

Stocks are getting stretched above their average traded price.
As noted by The Daily Shot, the largest ETF in the world is more than 11.5% above its Volume-Weighted Average Price (VWAP) over the past 250 trading days.
Per Investopedia:
"The volume-weighted average price (VWAP) is a trading benchmark used by traders that gives the average price a security has traded at throughout the day, based on both volume and price. It is important because it provides traders with insight into both the trend and value of a security.
VWAP is calculated by adding up the dollars traded for every transaction (price multiplied by the number of shares traded) and then dividing by the total shares traded.
Large institutional buyers and mutual funds use the VWAP ratio to help move into or out of stocks with as small of a market impact as possible. Therefore, when possible, institutions will try to buy below the VWAP, or sell above it. This way their actions push the price back toward the average, instead of away from it."
This is SPY's largest deviation from its rolling 250-day average VWAP since February.
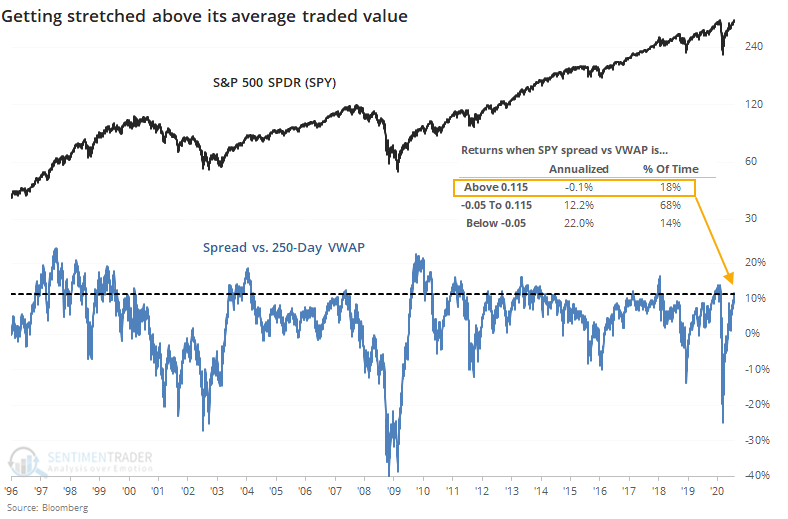
We can see from the chart that SPY's annualized return when this far above its one-year VWAP is -0.1%.
Taking a signal-based approach, the table below shows each time it has been stretched this far for the first time in at least three months.

SPY's returns going forward weren't terrible, but not great, either. It was below random on most time frames, with a relatively weak risk/reward ratio, especially over the short- to medium-term. On the plus side, it was positive most of the time, even if average returns weren't notable, and six months later showed only two losses.
To add additional context, the table below shows times when SPY has cycled from more than 10% below its average VWAP to more than 10% above.
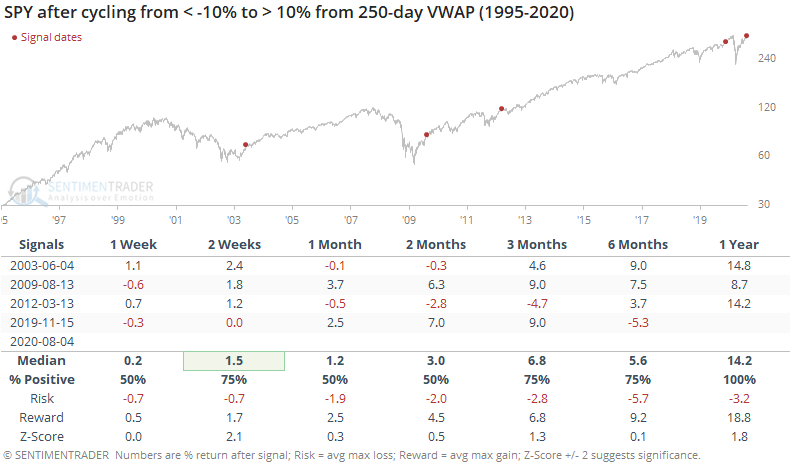
The sample size is tiny, so any conclusions are suspect. About the best thing we can say is that only one of the signals actually failed (though it took a while). The worst we can say is that SPY showed weakness or moderating gains on some time frame - either immediately in the aftermath of the recoveries in 2003 and 2012, or eventually after the recoveries in 2009 (shorter-term gains were erased) and 2019.
Since May, we've seen quite a few comparisons in price patterns and breadth thrusts to the summer of 2009, and this is another. There are also stark differences, so trying to overlay an analog to that one time period is highly questionable. Mostly, a stretch above average traded value like we're seeing now doesn't suggest an immediate correction, but it does at least warrant a bit of reduced enthusiasm given the poor annualized returns when it's this extreme.