Products
SentimenTrader Trading Tools
‍
Backtest Engine
My Trading Toolkit
Correlation Analysis
Seasonality
Indicators & Data API
‍
Proprietary Indicators & Charts
Market Data API
Strategies & Scanner
‍
50+ Trading Strategies
Smart Stock Scanner
Research Reports
‍
Research Solutions
Reports Library
Free Resources
Simple Backtest Calculator
Simple Seasonality Calculator
The Kelly Criterion Calculator
Sentiment Geo Map
Public Research Reports
Pricing
Company
About
In the News
Testimonials
Client Success Stories
Contact
Log inLoginSign up
< BACK TO ALL REPORTS

Staples' positive trends reach a record vs Nasdaq stocks

Jason Goepfert
2021-12-20
Over the past two weeks, there has been a historic surge in Consumer Staples stocks trading above their 50-day moving averages. At the same time, risk-off behavior among investors trading stocks on the Nasdaq exchange has pushed those stocks into downtrends. There is a record spread between trends in the sectors, but that has not been a consistent warning sign for the market.

Key points:

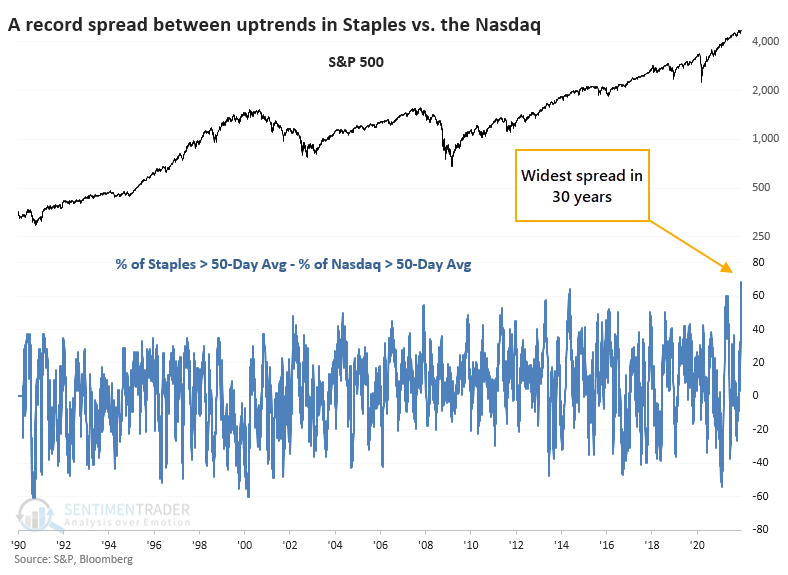
  • There is a record spread between stocks in uptrends in Consumer Staples versus those traded on the Nasdaq exchange
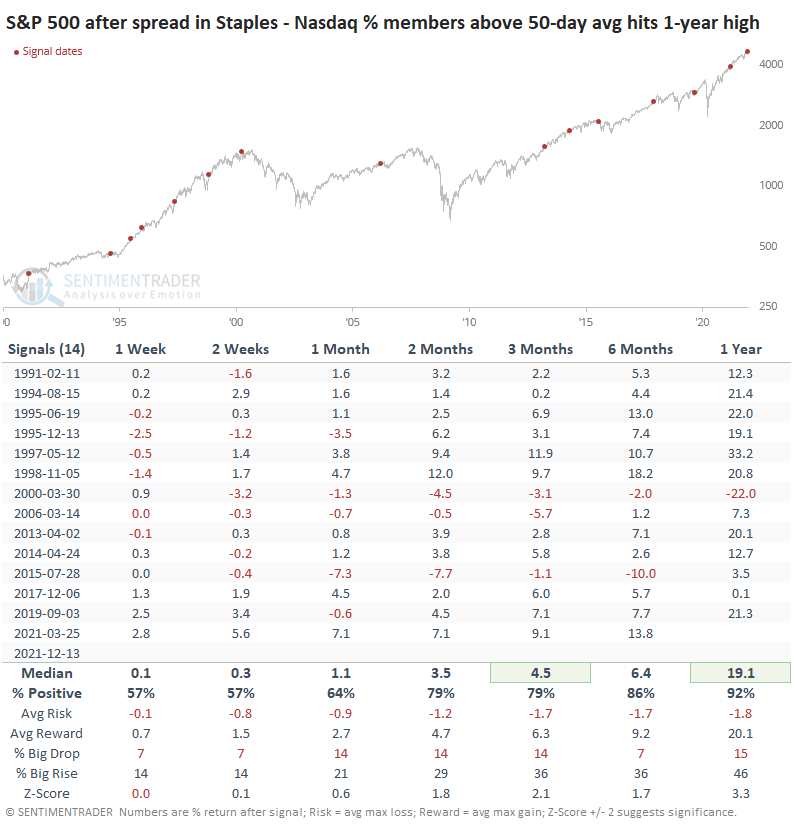
  • When the spread reached its highest level in a year, it did NOT suggest trouble for the broader market
  • Historically, the Nasdaq Composite tended to quickly rebound versus the Staples sector

Staples soaring while Nasdaq wilts

We've already seen that internal trends have been powerful in defensive sectors like Consumer Staples but curiously weak in higher-beta areas like the Nasdaq 100. It's even more fragile in the broader measures that look at the entire Nasdaq exchange.

The percentage of Staples stocks trading above their 50-day moving averages reached 90% last week, while fewer than 25% of stocks on the Nasdaq managed to hold their medium-term trends.

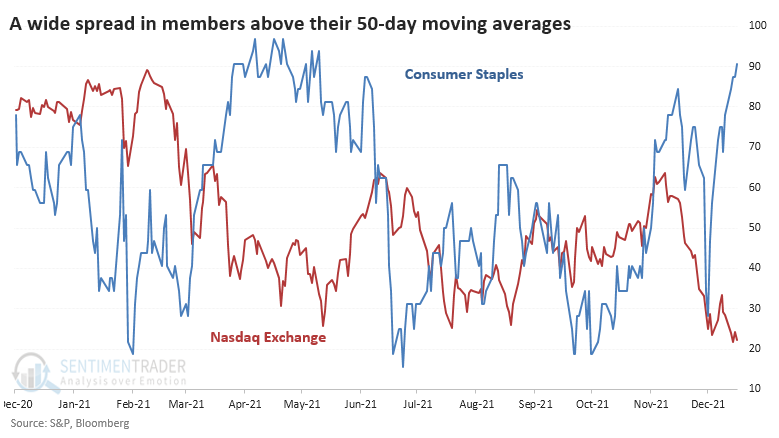
That's the widest spread in trends between the two groups in at least 30 years.

Not a consistent sign of persistent risk-aversion

It wasn't very successful if we took this as a warning sign for the broader market. The table below shows every time when the spread between trends in these two groups hit its highest level in at least a year. We only include signals when the S&P 500 was within 5% of a multi-year high at the time.

While the S&P's shorter-term returns were nothing special, its performance was well above random over the next 3-12 months. Over the next year, it showed a positive return 12 out of 13 times (and has a high probability of going 13 for 14). But that loser in 2000 was a major one as it effectively marked the peak of the bubble.

While it's tempting to conclude that this kind of behavior signals a change in fortunes between the two groups, it didn't work out that way most of the time. Staples showed a consistent tendency to underperform the Nasdaq Composite in the months ahead.

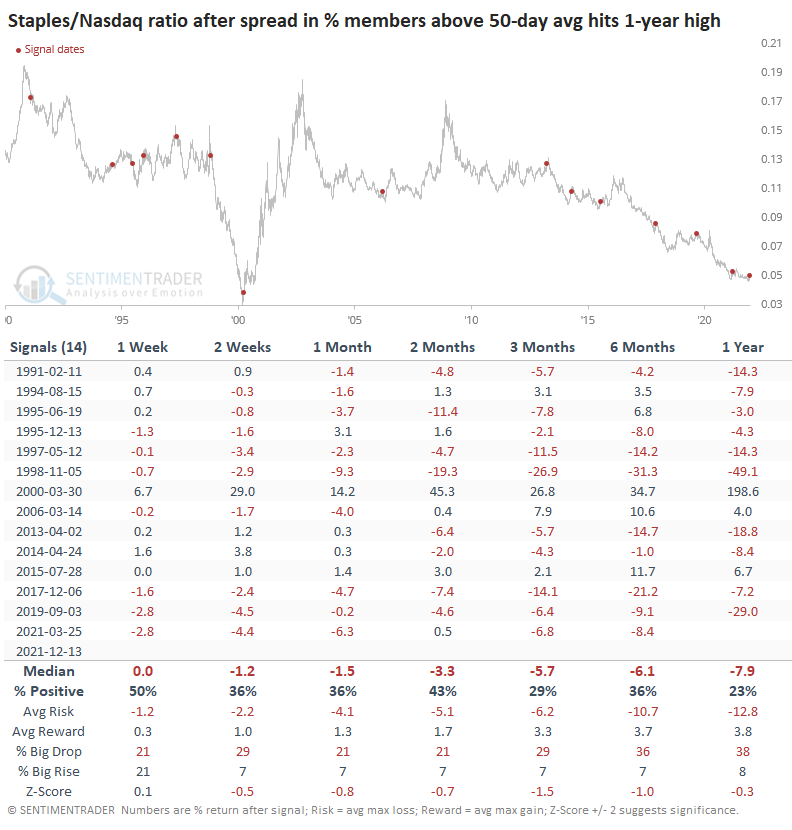
There were three significant exceptions to this. In 2000, Staples continued to outperform the Nasdaq across every time frame. Same for 2015. In 2006, Staples took a quick relative dive, then rebounded strongly. 

What the research tells us...

There is a historic spread between stocks enjoying medium-term uptrends in Consumer Staples versus those traded on the Nasdaq exchange. This shows a temporary bout of risk-off behavior among investors, but historically it's been rare to see this persist for much longer. It has not consistently indicated that a major change in trend has occurred, but if Staples continue to outperform in the weeks ahead, that probability will increase.

PRODUCTS
SentimenTrader
Trading Tools
Indicators & Data API
‍
Strategies & Scanner
‍
Research Reports
FREE
RESOUrCES
Simple Backtest
Calculator
Simple Seasonality
Calculator
The Kelly Criterion
Calculator
Sentiment Geo Map
‍
Public Research Reports
‍
Pricing
Bundle pricing
‍
Announcements
‍
FAQ
COMPANY
‍
About
‍
In the News
‍
Testimonials
‍
Client Success Stories
CONTACT
‍
General Inquiries
‍
Media Inquiries
‍
Financial Professionals Inquiries
‍
© 2025 Sundial Capital Research Inc. All rights reserved.
Setsail Marketing
TermsPrivacyAffiliate Program
Risk Disclosure: Futures and forex trading contains substantial risk and is not for every investor. An investor could potentially lose all or more than the initial investment. Risk capital is money that can be lost without jeopardizing ones’ financial security or life style. Only risk capital should be used for trading and only those with sufficient risk capital should consider trading. Past performance is not necessarily indicative of future results.

Hypothetical Performance Disclosure: Hypothetical performance results have many inherent limitations, some of which are described below. No representation is being made that any account will or is likely to achieve profits or losses similar to those shown; in fact, there are frequently sharp differences between hypothetical performance results and the actual results subsequently achieved by any particular trading program. One of the limitations of hypothetical performance results is that they are generally prepared with the benefit of hindsight. In addition, hypothetical trading does not involve financial risk, and no hypothetical trading record can completely account for the impact of financial risk of actual trading. for example, the ability to withstand losses or to adhere to a particular trading program in spite of trading losses are material points which can also adversely affect actual trading results. There are numerous other factors related to the markets in general or to the implementation of any specific trading program which cannot be fully accounted for in the preparation of hypothetical performance results and all which can adversely affect trading results.

Testimonial Disclosure: Testimonials appearing on this website may not be representative of other clients or customers and is not a guarantee of future performance or success.