
Staples versus discretionary versus inflation

Key Points
- Being in the right sector at the right time is one of the lesser appreciated keys to above-average performance
- The level of price inflation impacts purchasing power and thus affects different sectors differently
- In this piece, we look at performance for consumer staples versus consumer discretionary based on varying levels of inflation
Staples versus Discretionary: A systematic approach
One factor that few investors consider when allocating between staples and discretionary is inflation. Let's focus on a strategy that relies solely on inflation to decide whether to be in the staples or discretionary sectors. We will:
- Measure inflation using the 12-month rate-of-change in the Consumer Price Index
- Analyze the latest available data only at the end of each month
- Use the month-end reading to decide what to hold during the following month
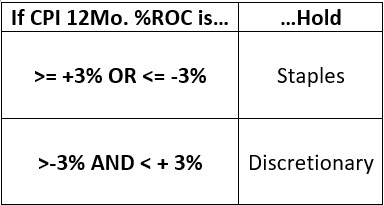
The rules are simple. If inflation is:
- Relatively high (greater than or equal to +3%) OR relatively low (less than or equal to -3%, i.e., deflation) we will favor consumer staples
- Within a range of relatively mild readings (greater than -3% to less than +3%), we will prefer consumer discretionary
For testing, we will use S&P Industry Group data from Bloomberg dating from January 1, 1927, through February 28, 2022. The cumulative returns for each sector based on inflation at the end of the previous month appear below.
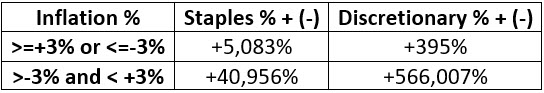
The bottom line is that discretionary has vastly outperformed over a long period of time when inflation is moderate, and staples have significantly outperformed when inflation is abnormally high or low.
Periods of above or below average inflation
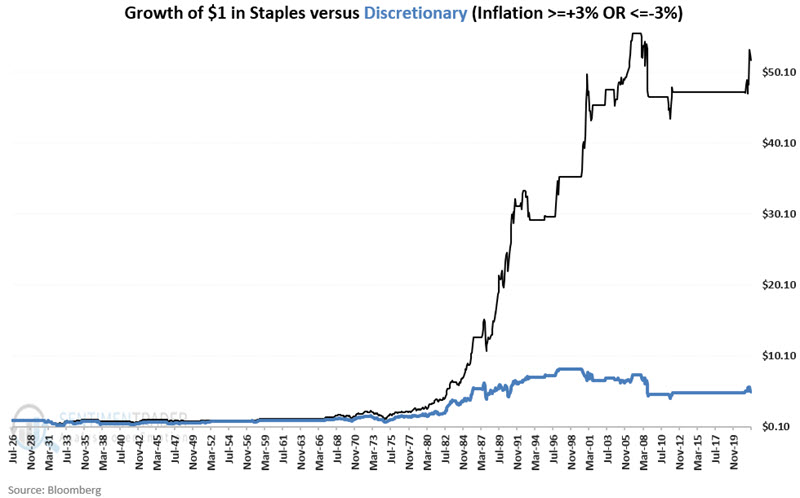
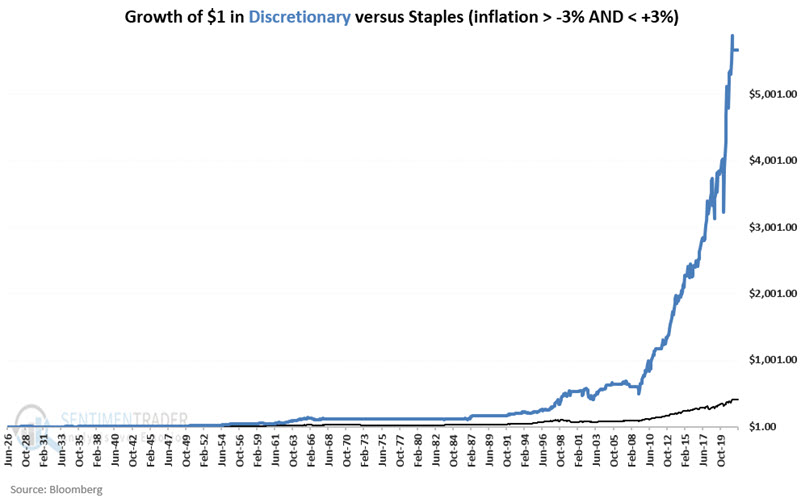
The chart below displays the growth of $1 invested in staples and discretionary sectors ONLY when inflation is above 3% or below -3%.
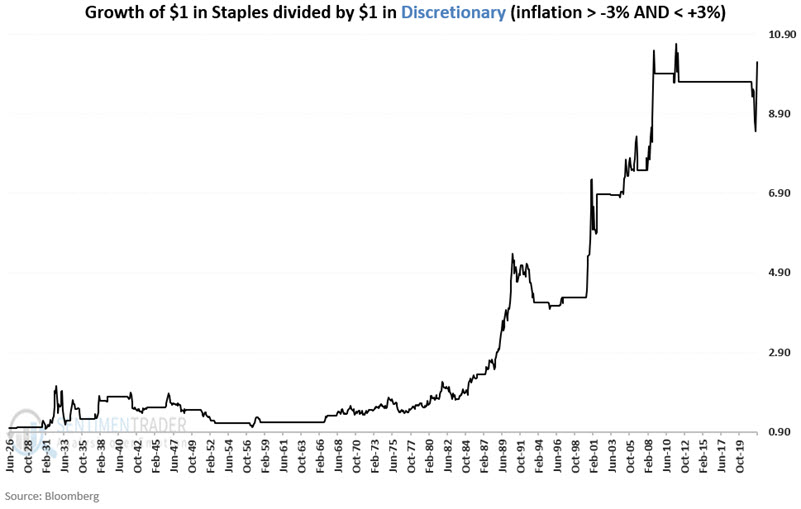
The chart below displays the growth of $1 in staples divided by $1 in discretionary during periods of above or below average inflation. Notice there wasn't much difference until the 1960s. From there, staples have vastly outperformed.
At the far right of the chart below, note that inflation crossed above +3% at the end of June 2021. For the first four months, discretionary outperformed. Since then, things have shifted dramatically back in favor of staples.
Periods of moderate inflation
The chart below displays the growth of $1 invested in staples and discretionary sectors ONLY when inflation is above -3% and below +3%, i.e., not too high or low.
The chart below displays the growth of $1 in discretionary divided by $1 in staples during periods of average inflation (between plus and minus 3%). 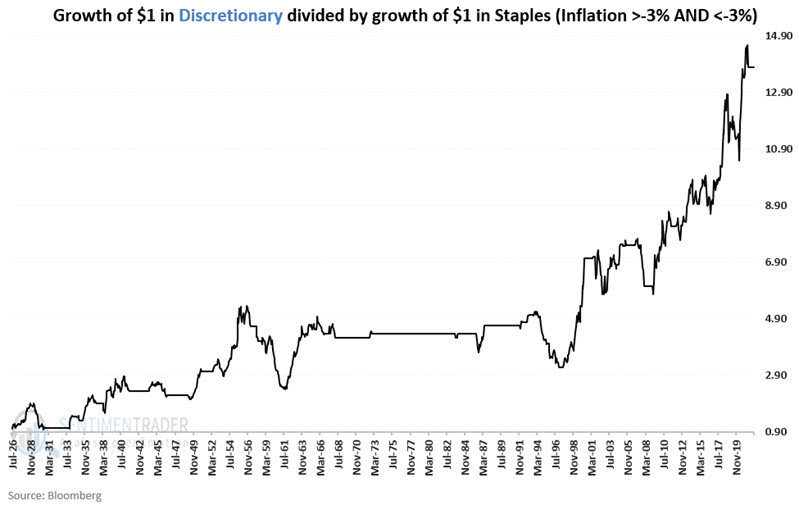
Creating a strategy
Now let's compare the following strategies:
- Starting in January 1999 using monthly total return data for ETFs XLP (Consumer Staples Select Sector SPDR Fund) and XLY (Consumer Discretionary Select Sector SPDR Fund)
- Strategy A holds XLY (discretionary) when inflation is -3% to +3% and holds XLP (staples) when inflation is greater than +3% or less than -3%.
- Strategy B splits 50/50 between staples and discretionary on a buy-and-hold basis
The chart below displays the cumulative hypothetical growth of $1 invested using strategy A and strategy B
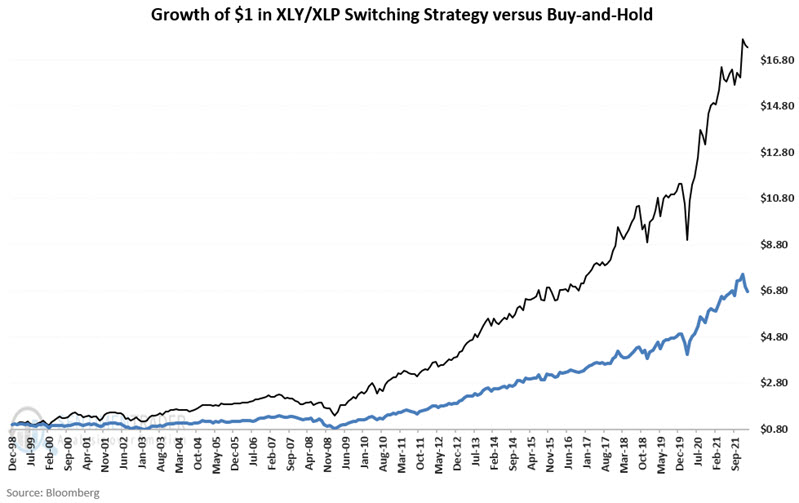
From January 1999 through February 2022, Strategy A grew +1,633%, and Strategy B grew +578%. The chart below displays the growth of Strategy A divided by the growth of Strategy B.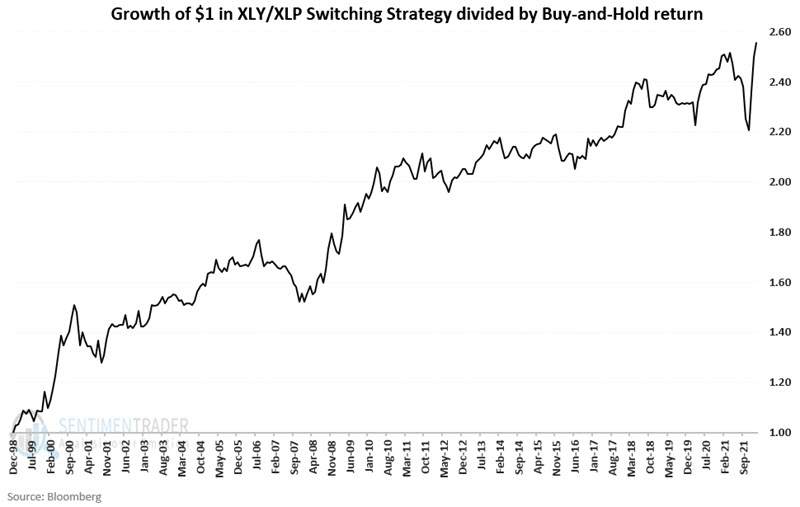
More recently, CPI inflation crossed above +3% at the end of June 2021. Since that time and through 3/1/2022, XLP is up +8.6%, and XLY is up +1.3%.
What the research tells us…
In a macro sense, the consumer discretionary sector represents "wants," and the consumer staples sector represents "needs." Because inflation impacts purchasing power, it affects people's buying decisions. When inflation is moderate, individuals are generally more comfortable spending their money on "wants." However, when inflation is abnormally high or low, individuals tend to focus primarily on spending their money on "needs." The long-term results displayed in the charts above suggest that this theory is true.