
Stochastic Indicator: everything you need to know
The Stochastic Oscillator (also called "Stochastic indicator") is an indicator that seeks to understand how strong the market's momentum is. The market is overbought when the Stochastic Oscillator is very high and the market is oversold when the Stochastic Oscillator is very low. Unlike RSI which uses the market's daily movements, the Stochastic Oscillator looks at the market in comparison to its recent range. In this post I'll show you EVERYTHING you need to know about the Stochastic Oscillator:
- What is the Stochastic Oscillator and how to calculate it?
- How can traders use this indicator?
- Skepticism towards this indicator.
- How well does the Stochastic Indicator actually work? No hype, just the data and facts.
What is the Stochastic Indicator, and how to calculate it
The Stochastic Indicator demonstrates the market's momentum by looking at the market's current price in relation to its recent range (highs and lows). The Stochastic indicator was developed by George Lane in the 1950s, and is broken down into 2 parts:
- %K = ((latest CLOSE price - lowest price over the last N periods) / (highest price over the last N periods - lowest price over the last N periods)) x 100
- %D = 3 day simple moving average of %K
*This indicator can be applied to any time frame chart (hourly, daily, weekly), but for this post we'll look at the stochastic on a daily chart.
"N" periods can be customized to whatever you want, but the most common setting is "14". This means that the Stochastic indicator is:
- %K = ((latest CLOSE price - lowest price over the last 14 days) / (highest price over the last 14 days - lowest price over the last 14 days)) x 100
- %D = 3 day simple moving average of %K
As you can see, %K basically looks at where the market is right now in relation to its range over the past 14 days. Meanwhile, %D smooths out %K, making %K less choppy and sensitive to the market's daily price changes.
Here's an example of stochastics with a daily chart of the S&P 500:
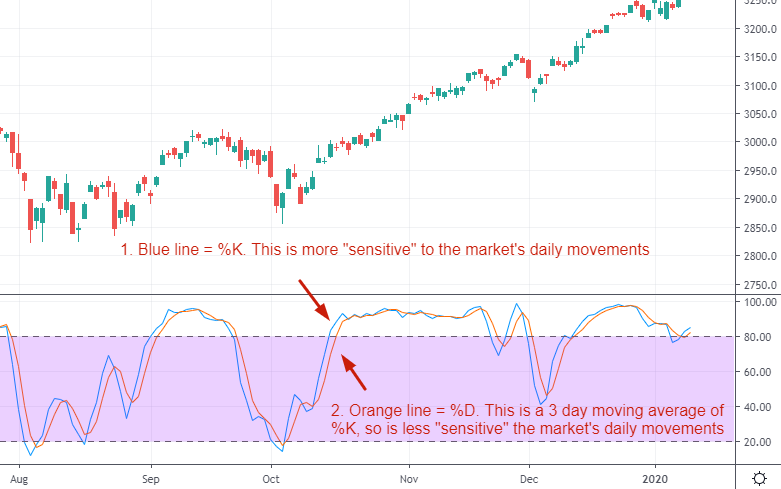
*All charts courtesy of TradingView
So how does this illustrate the market's momentum?
- As the market trends higher, the market will be at the upper end of its 14 day range. Hence, %K will go up, and %D will follow %K higher.
- As the market trends lower, the market will be at the lower end of its 14 day range. Hence, %K will go down, and %D will follow %K lower.
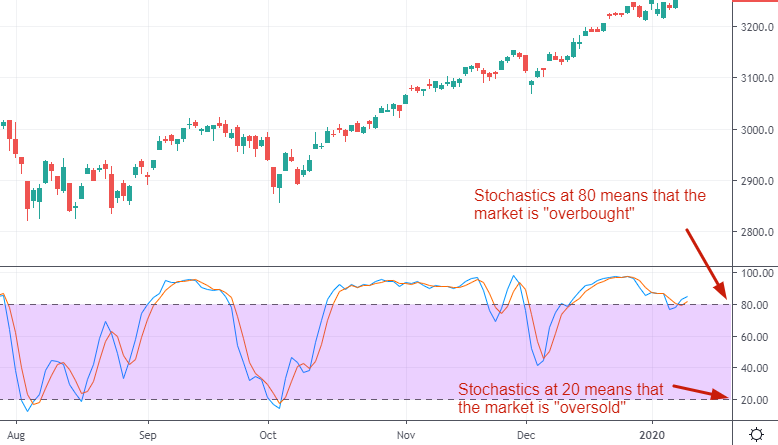
Most charts also add an "envelope" around the stochastic indicator to demonstrate when the market is "overbought" and "oversold". These levels can be customized to anything you want, but in general:
- 80 = overbought
- 20 = oversold
Due to the way it's calculated, Stochastics cannot exceed 100 and cannot fall below 0.
How can traders use the Stochastic Oscillator to trade?
There are 4 main ways in which you can use the Stochastic indicator when trading. I'll explain each strategy in detail, show you when it works and when it doesn't work. And finally, I'll show you EXACTLY how well each strategy works when you add up the successes and failures since there is no such thing as a holy grail in the markets. The 4 main stochastic strategies are:
- Look for extremes in stochastics. Go long when the market is "oversold" and go short when the market is "overbought".
- Look for "divergences" between the stochastic indicator and the market
- Trade when %K and %D crossover after being overbought or oversold
- Use stochastics in combination with a trend-identifying indicator
Let's dive into each of these strategies:
Strategy #1: look for extremes in stochastics
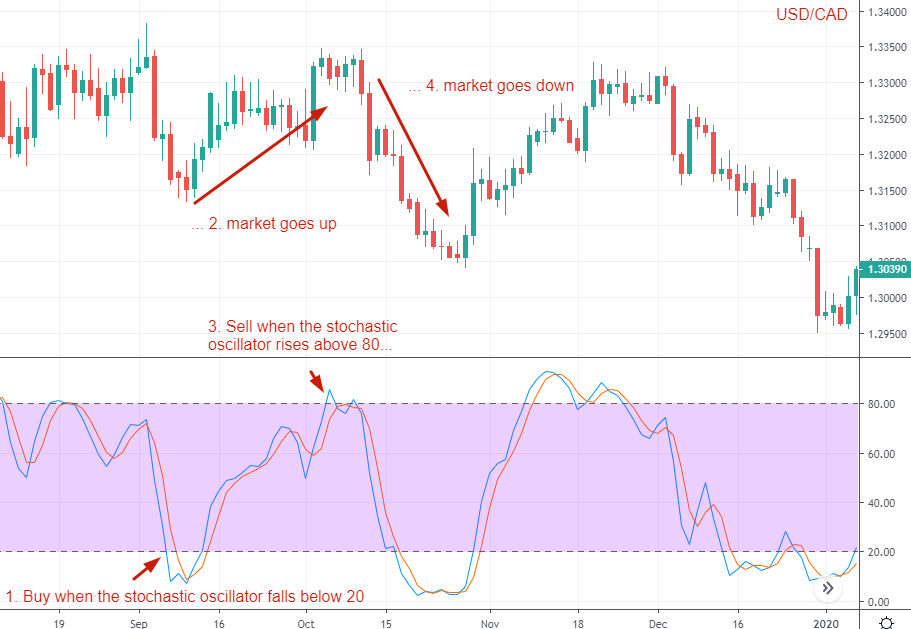
The most common stochastic trading strategy is to look for "overbought" and "oversold" extremes. This means that you should:
- Buy when the Stochastic Oscillator (%K) falls below 20 (oversold)
- Sell when the Stochastic Oscillator (%K) rises above 80 (overbought)
The logic behind this strategy is that when the market rallies "too much", it's more likely to make a pullback. On the other hand, if the market falls "too much", it's more likely to make a bounce. This is particularly true when the market has been swinging sideways within a range.
Here's an example of going long when the stochastic oscillator is oversold (falls below 20) and short when the stochastic oscillator is overbought (rises above 80):
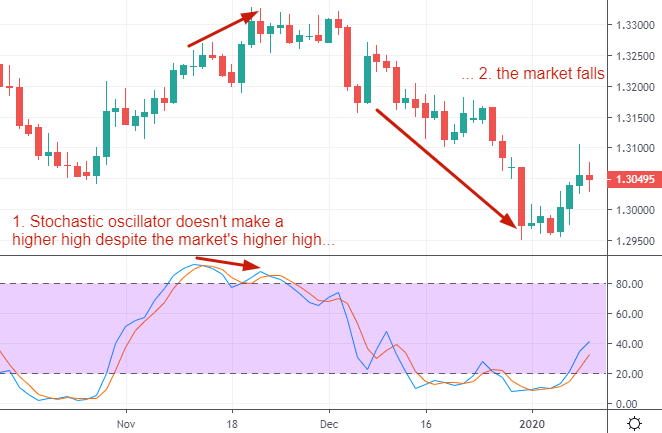
Strategy #2: look for "divergences" between the stochastic oscillator and the market
Many traders who try to predict tops and bottoms in markets do so by looking for "divergences". A divergence occurs when:
- The market goes up and makes higher highs, but the stochastic indicator does not make higher highs. This indicates that the market's overextended rally may be losing steam, so perhaps the market will fall soon.
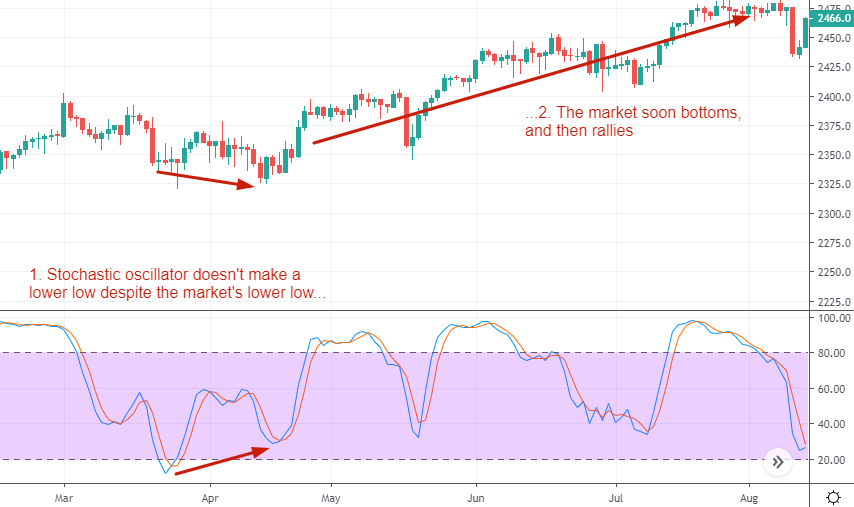
- The market goes down and makes lower lows, but the stochastic indicator does not make lower lows. This indicates that the market's oversold decline may be slowing down, so perhaps the market will rally soon.
Once again, here's an example of a bearish stochastic divergence using the U.S. Dollar - Canadian Dollar forex pair:
Here's an example of a bullish stochastic divergence using the S&P 500 in 2017:
Strategy #3: trade on the crossovers
We already discussed 2 contrarian trading strategies based on stochastics. Traders can also use a strategy that combines elements of contrarian trading with trend following.
In this strategy, a trader will look for extreme stochastic readings, and then execute a trade when the market "rolls over". This means that you should:
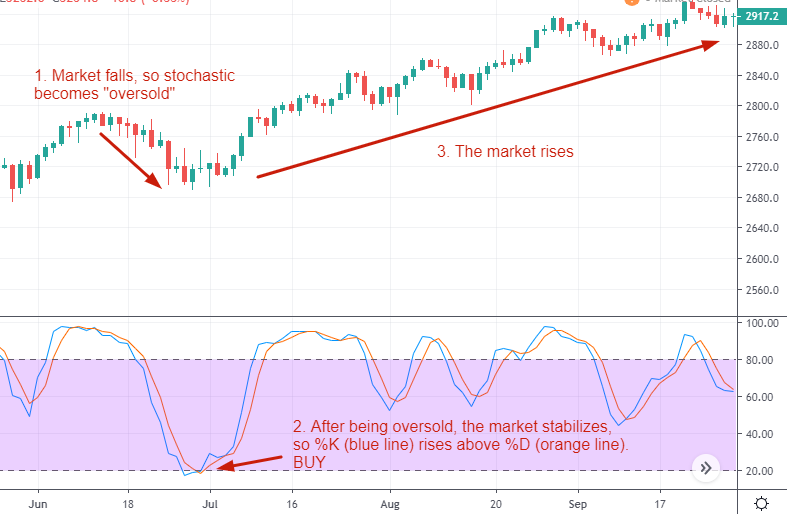
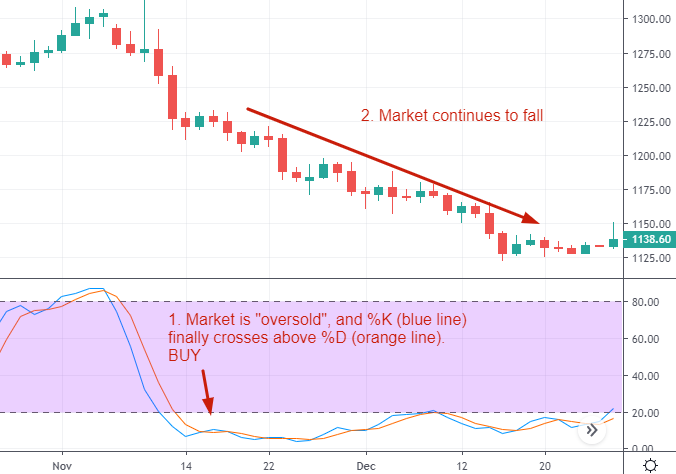
- Buy when the stochastic indicator (%K) is oversold (below 20) and %K crosses above %D. (In other words, go long when the market is oversold, but is starting to reverse upwards).
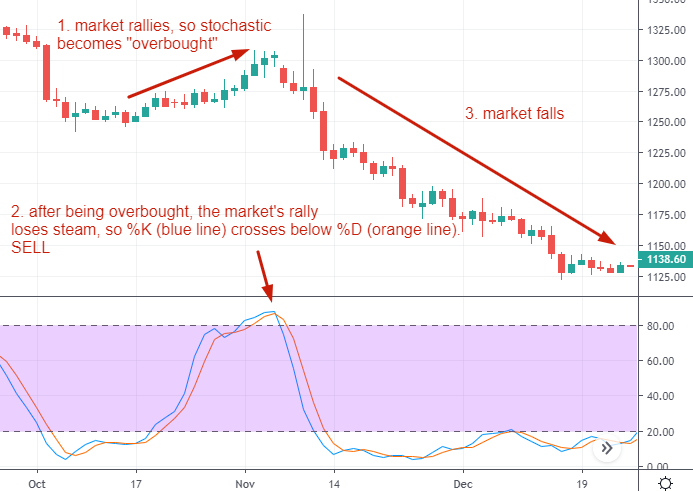
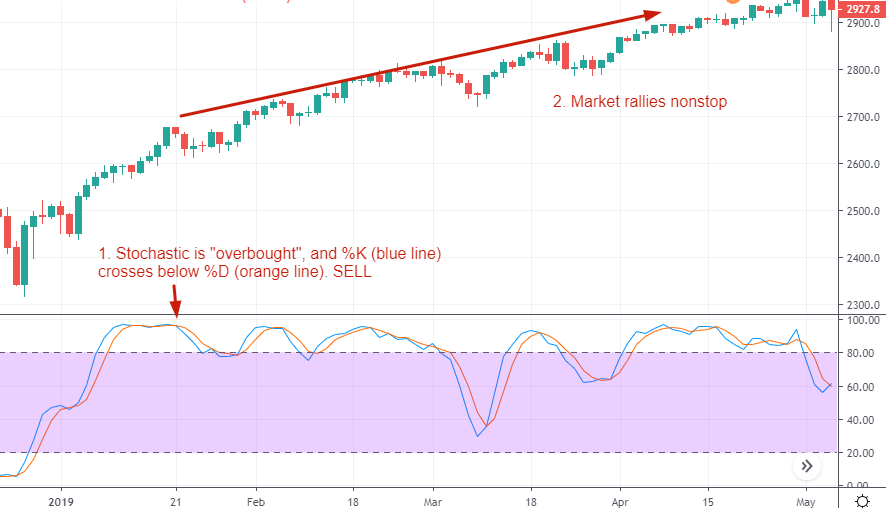
- SELL when the stochastic indicator (%K) is overbought (above 80) and %K crosses below %D. (In other words, go short when the market is overbought, but is starting to reverse downwards).
Here's an example of a bullish stochastic crossover with the S&P 500 in 2018:
Here's an example of a bearish stochastic crossover:
Strategy #4: use stochastics in combination with other indicators
The final stochastic strategy is to use this indicator in combination with other indicators that define the market's trend. This means that:
- You should look to go long when the market is in an uptrend, has made a short term pullback, and its stochastic is oversold.
- You should look to go short when the market is in a downtrend, has made a short term bounce, and its stochastic is overbought.
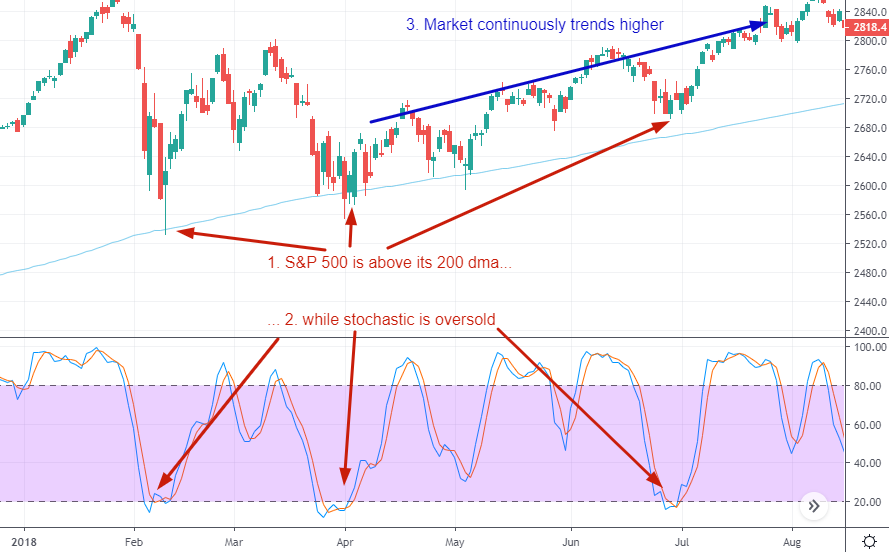
How do we define the market's trend? There are many ways, but one of the easiest and most common ways is to simply look at the market's 200 day moving average (dma). This means that:
- You should go long when the market is above its 200 dma, has made a short term pullback, and its stochastic is below 20
- You should go short when the market is below its 200 dma, has made a short term bounce, and its stochastic is above 80
Here's an example of a bullish trade using this trading setup with the S&P 500 in 2018:
Here's an example of a bearish trade using this trading setup with crude oil in 2017:
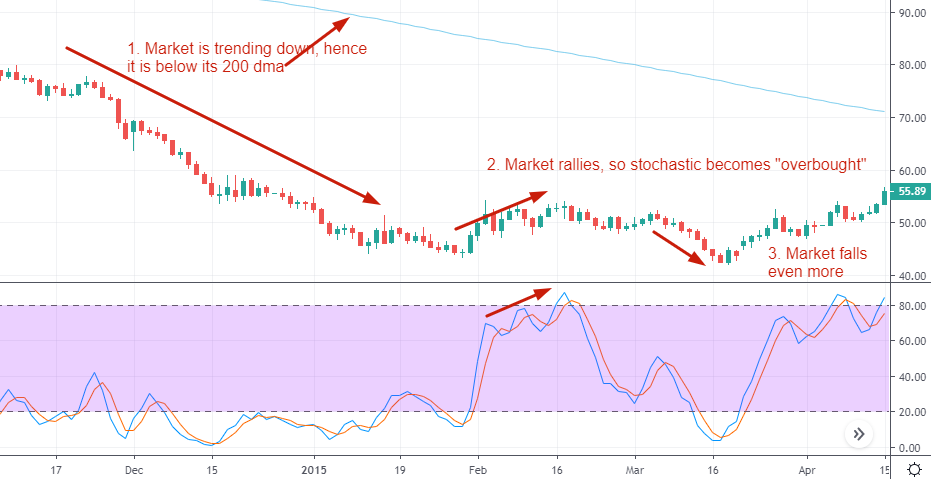
Skepticism towards the Stochastic Oscillator
Here's the thing about trading: there's no such thing as a holy grail. No indicator works 100% of the time. Before we look at EXACTLY how well the stochastic oscillator works when trading, we must first examine some logic to understand under what circumstances it may not work. Here are some reasons why each of the 4 stochastic strategies listed above may fail when trading.
Strategy #1: look for extremes in stochastics
Simply put, "extreme" can become even more extreme.
- Just because the market has rallied a lot and is "overbought", doesn't mean that the market must fall.
- Just because the market has fallen a lot and is "oversold", doesn't mean that the market must rally.
There is no such thing as "the market has rallied/fallen TOO much, hence it MUST reverse".
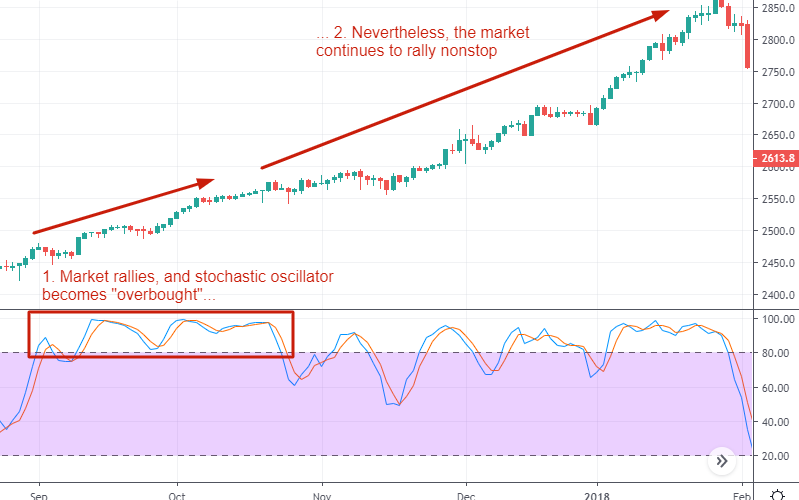
Here's an example of the S&P 500 in 2017 continuing to rally despite the stochastic oscillator suggesting that the market is "overbought"
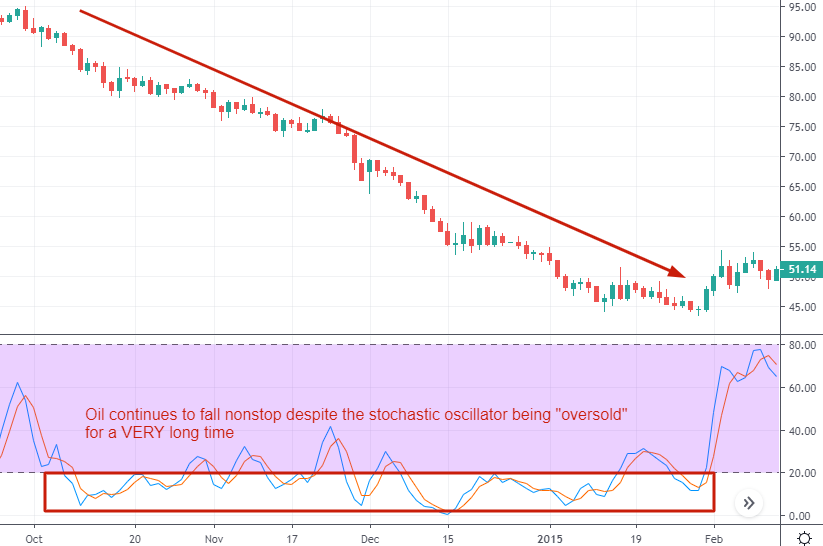
Here's an example of oil in 2014 continuing to fall despite the stochastic oscillator suggesting that the market is "oversold"
Strategy #2: look for "divergences" between the stochastic oscillator and the market
As is the case with most divergences, stochastic "divergences" are extremely vague concepts. Since the concept of a "divergence" is hard to quantify, no 2 traders will spot the same divergence on a chart. MOREOVER, successful divergences are obvious with 20/20 hindsight, while the human eye tends to skip over failed divergences when staring at a chart.
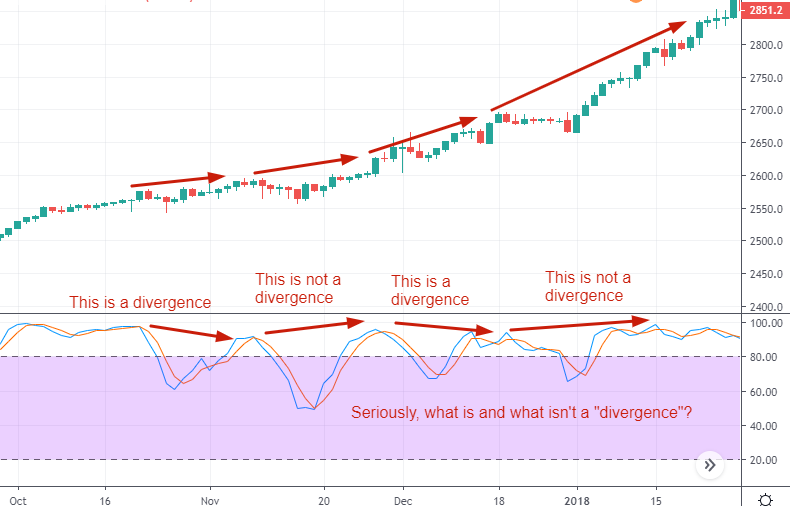
In addition, many divergences simply don't work. All of the "bearish divergences" in the above chart failed as the market rallied relentlessly.
Strategy #3: trade on the crossovers
This strategy may fail for the same reason that strategy #1 fails: "extreme" can become even more extreme, even if the market looks like it's rolling over.
- Just because stochastic is oversold and %K has crossed above %D, doesn't necessarily mean that the market will rally.
- Just because stochastic is overbought and %K has crossed below %D, doesn't mean that the market will fall.
Here's an example of a failed bullish crossover with gold in 2016:
Here's an example of a failed bearish crossover with the S&P 500 in 2019:
Strategy #4: use stochastics in combination with other indicators
There is nothing inherently wrong with this strategy, since the data easily proves that trading on the side of the trend is generally the right thing to do (go long in an uptrend and go short in a downtrend).
HOWEVER, skeptics may ask "is this strategy really better than ignoring stochastics all together"? For example.
- Is "going long when the market is above its 200 dma and its stochastic is below 20" really any different from "going long on ANY RANDOM DAY when the market is above its 200 dma?"
- Is "going short when the market is below its 200 dma and its stochastic is above 80" really any different from "going short on ANY RANDOM DAY when the market is below its 200 dma?"
In other words, does adding stochastics actually result in any benefit beyond what a simple trend filter like the 200 dma provides? I'll use data to answer this question later in this post.
How useful is the Stochastic Oscillator when trading?
We looked at 4 stochastic indicator trading strategies:
- Look for stochastic extremes (contrarian)
- Look for "divergences" (contrarian)
- Trade when %K and %D crossover after being overbought or oversold (contrarian + trend following)
- Use stochastics in combination with a trend-identifying indicator (contrarian + trend following)
Now comes the moment of truth. How well does the stochastic oscillator actually work? A lot of trading gurus and books tout various "secret trading strategies and indicators" which are not much better than a 50/50 coin toss in the long run. To sell their "secrets", these gurus only focus on the successful trades that their indicators generate and sweep the failures under the rug.
So in order to be objective, we're going to let data tell us exactly how well the stochastic oscillator works. No sweeping failures under the rug. Let's look at the successes AND failures. We're going to test all 4 of these strategies except the "divergence" strategy, since the concept of a "divergence" is extremely vague and hard to quantify.
We'll test these 3 strategies on the S&P 500, gold, and the U.S. dollar index:
- Look for stochastic extremes (contrarian)
Look for "divergences" (contrarian)- Trade when %K and %D crossover after being overbought or oversold (contrarian + trend following)
- Use stochastics in combination with a trend-identifying indicator (contrarian + trend following)
*You can test these stochastic strategies on any market you want. But for the sake of keeping this post brief, we'll stick to these 3 markets.
*Most forex traders don't trade the U.S. Dollar Index - they trade specific forex pairs. But the U.S. Dollar Index does correlate with many currency pairs, so if you're a forex trader then please use the following data for demonstration purposes only.
*All strategies here use the daily stochastic oscillator (not the hourly, weekly, or monthly stochastic oscillator)
How well does strategy #1 work:
For the S&P 500:
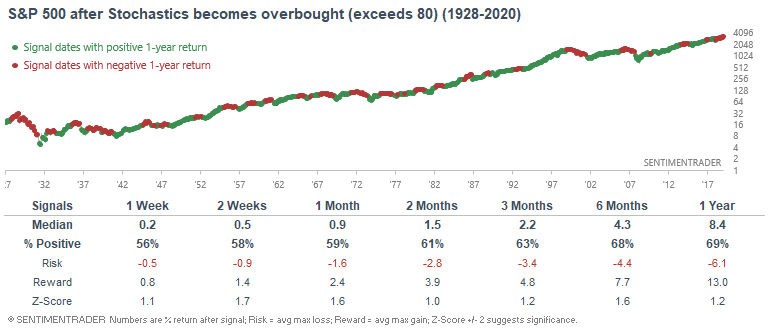
Here's what happens next to the S&P 500 after the Stochastic Oscillator (%K) rises above 80 (overbought):
*1043 historical cases
Here's what happens next to the S&P 500 after the Stochastic Oscillator (%K) falls below 20 (oversold):
*813 historical cases
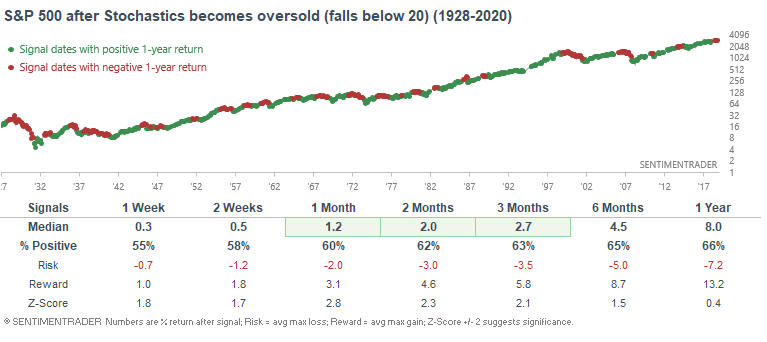
As you can see, overbought stochastic readings aren't consistently bearish for the S&P 500. Meanwhile, oversold stochastic readings are more bullish than random for the S&P 500 (as you would expect).
For gold:
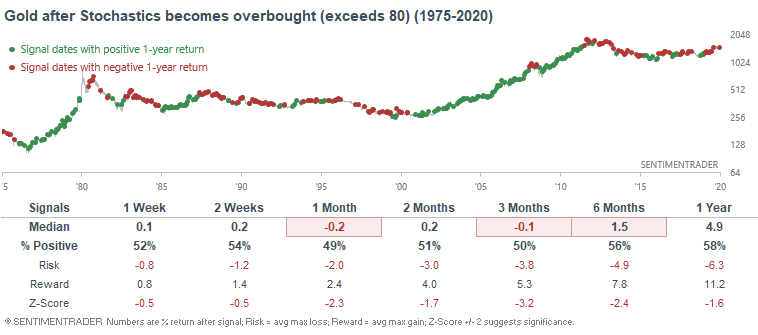
Here's what happens next to gold after the Stochastic Oscillator (%K) rises above 80 (overbought):
*364 historical cases
Here's what happens next to gold after the Stochastic Oscillator (%K) falls below 20 (oversold):
*374 historical cases
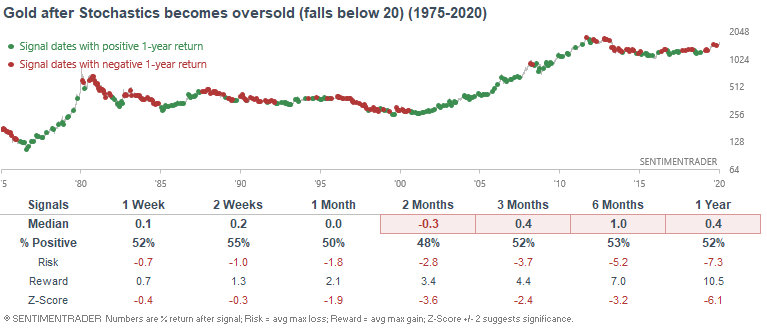
Here we can see something interesting. BOTH overbought and oversold stochastic readings are more bearish than random for gold. When gold rallies too much and its stochastic becomes overbought, it tends to pullback. And when gold starts to fall and its stochastic is oversold, it often falls EVEN MORE before it can bottom.
For the U.S. Dollar Index:
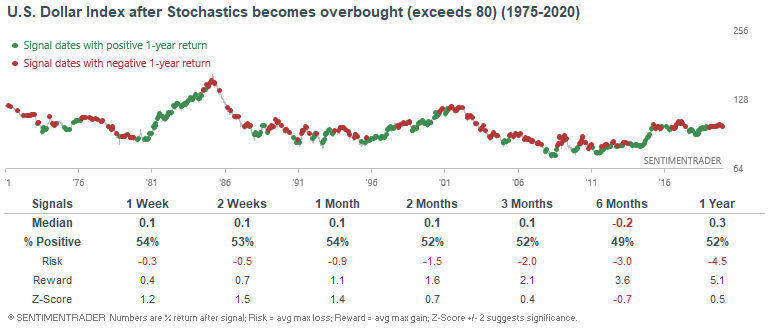
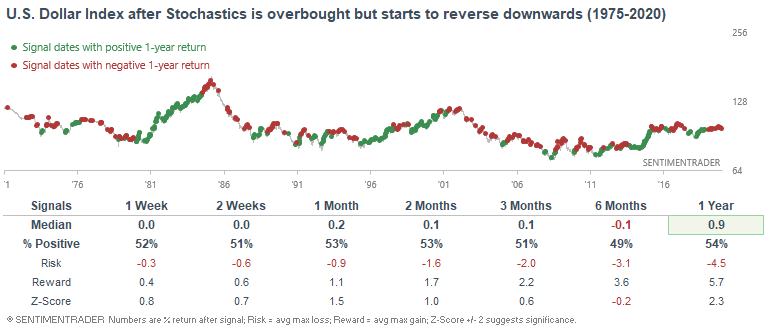
Here's what happens next to the U.S. Dollar Index after the Stochastic Oscillator (%K) rises above 80 (overbought):
*469 historical cases
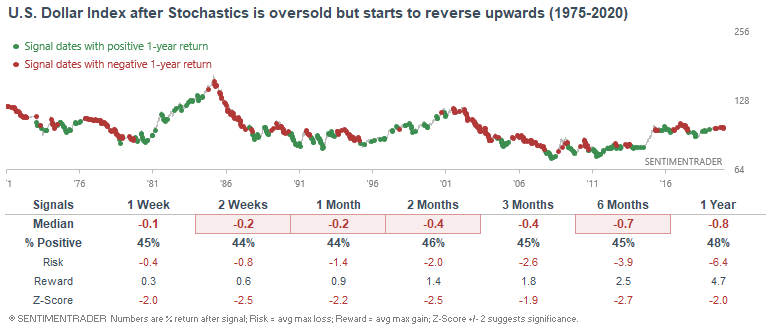
Here's what happens next to the U.S. Dollar Index after the Stochastic Oscillator (%K) falls below 20 (oversold):
*467 historical cases
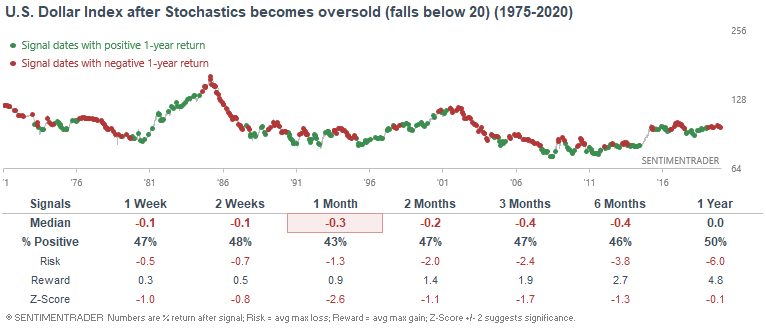
In conclusion, high stochastic readings are slightly more bullish than random for the USD, and low stochastic readings are more bearish than random for the USD. Extremes often become more extreme before the market reverses.
How well does strategy #2 work:
For the S&P 500:
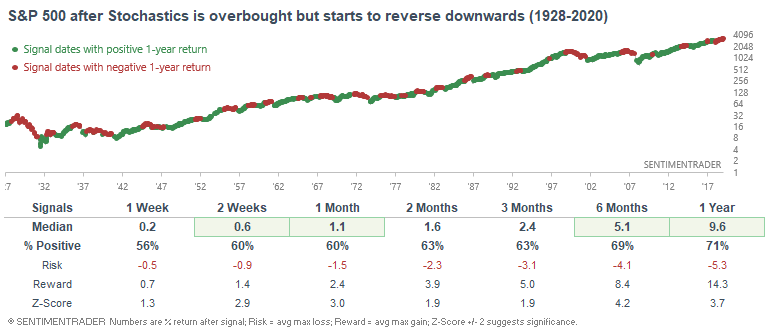
Here's what happens next to the S&P 500 if you sell when the stochastic indicator is overbought, and then %K crosses below %D:
*1339 historical cases:
Here's what happens next to the S&P 500 if you buy when the stochastic indicator is oversold, and then %K crosses above %D:
*702 historical cases
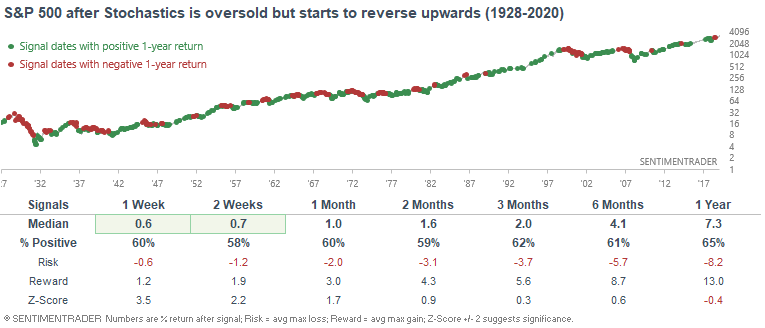
Conclusion: contrary to what you may expect, cases in which stochastics were overbought and it "looked like" the market was reversing downwards didn't usually see the market fall. On the other hand, cases in which stochastics were oversold and it "looked like" the market was reversing upwards usually saw the market rally.
For gold:
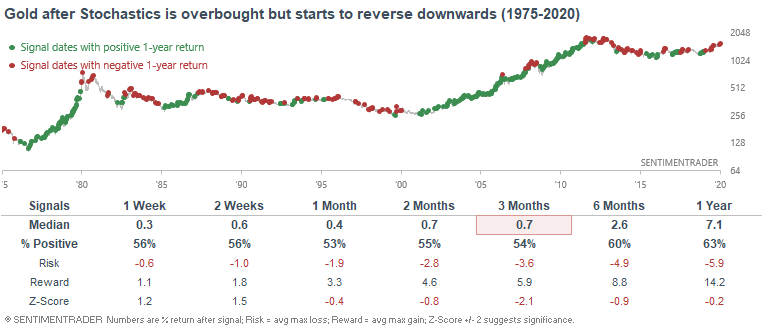
Here's what happens next to gold if you sell when the stochastic indicator is overbought, and then %K crosses below %D:
*460 historical cases:
Here's what happens next to gold if you buy when the stochastic indicator is oversold, and then %K crosses above %D:
*432 historical cases
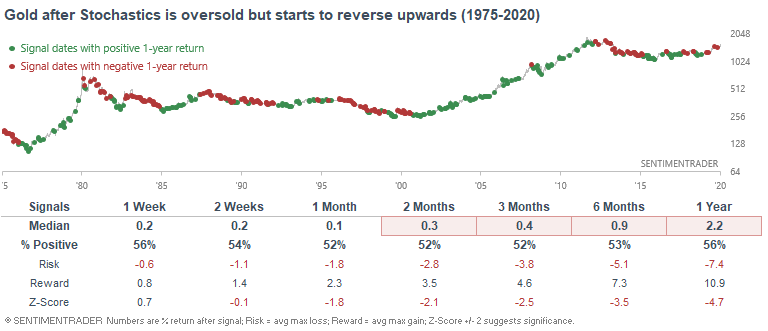
Conclusion: the usefulness of this stochastics strategy is questionable for gold, since gold's forward returns were not significantly different from 50/50 in both cases.
For the U.S. Dollar Index:
Here's what happens next to the USD if you sell when the stochastic indicator is overbought, and then %K crosses below %D:
*508 historical cases:
Here's what happens next to the USD if you buy when the stochastic indicator is oversold, and then %K crosses above %D:
*541 historical cases
Conclusion: selling because the stochastic indicator is overbought and the market "looks like" it was reversing downwards didn't usually work out - the USD's forward returns were not much different form 50/50. Meanwhile, buying because the stochastic indicator is oversold and the market "looks like" it was reversing upwards didn't usually work out since the USD often continued to fall.
How well does strategy #3 work:
For the S&P 500:
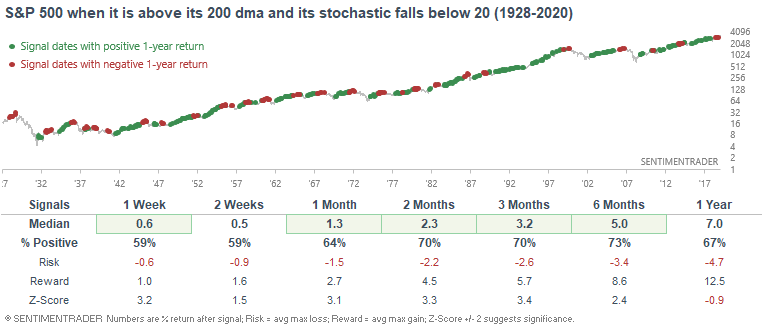
Here's what happens if you buy the S&P 500 when it is above its 200 dma and its stochastic falls below 20:
*428 historical cases
Here's what happens if you sell the S&P 500 when it is below its 200 dma and its stochastic rises above 80:
*272 historical cases
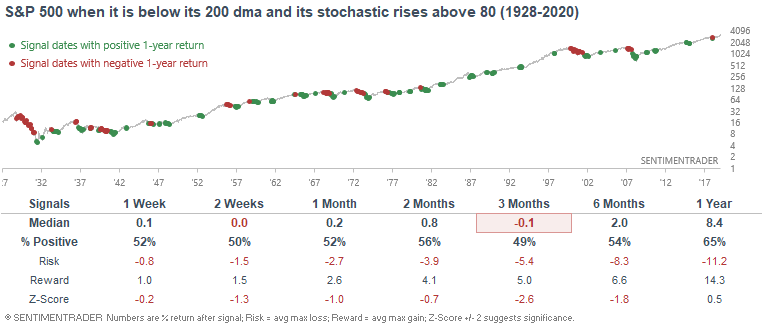
Conclusion: turning bullish when the market is temporarily oversold during an uptrend usually works, and turning bearish when the market is temporarily overbought during a downtrend is not a bad trade to put on.
For gold:
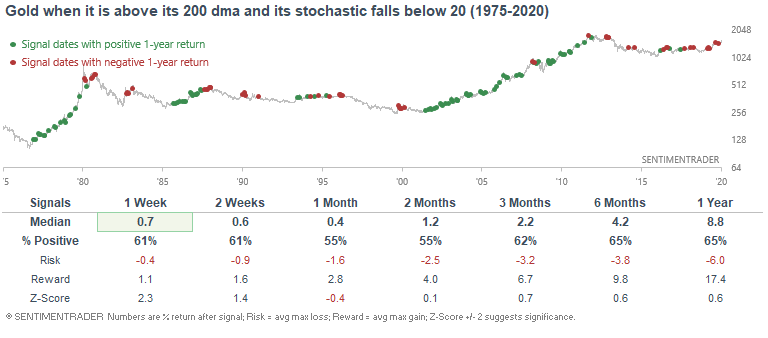
Here's what happens if you buy gold when it is above its 200 dma and its stochastic falls below 20:
*148 historical cases
Here's what happens if you sell gold when it is below its 200 dma and its stochastic rises above 80:
*120 historical cases
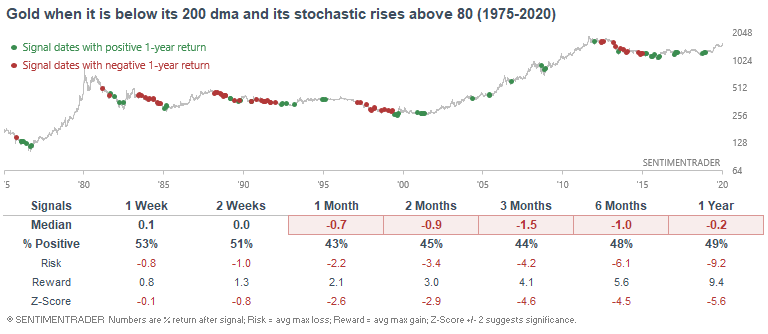
Conclusion: turning bullish when the market is oversold during an uptrend doesn't work for gold, but turning bearish when the market is overbought during a downtrend works.
For the U.S. Dollar Index:
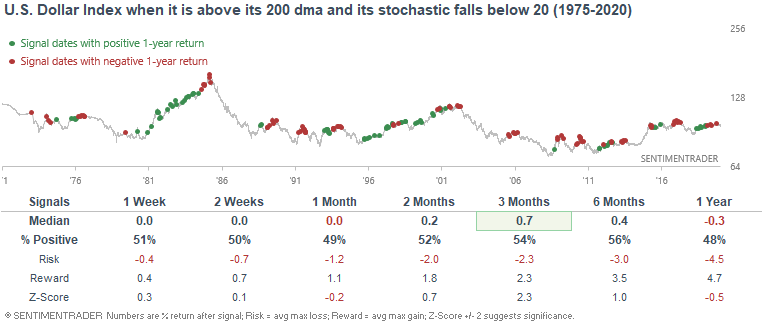
Here's what happens if you buy the U.S. Dollar Index when it is above its 200 dma and its stochastic falls below 20:
*169 historical cases
Here's what happens if you sell the U.S. Dollar Index when it is below its 200 dma and its stochastic rises above 80:
*190 historical cases
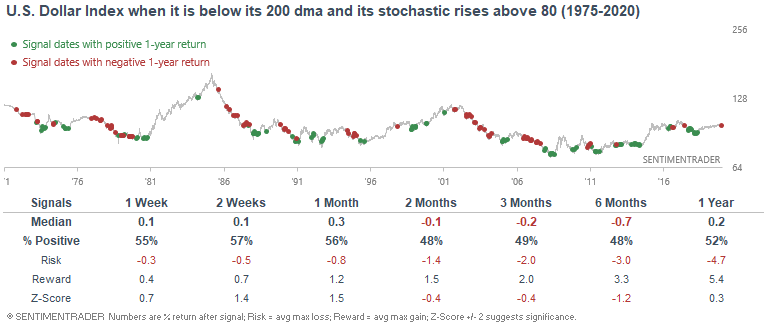
Conclusion: this strategy doesn't work very well for the U.S. Dollar.
Key takeaways
Here are some key points that you should remember about the Stochastic Oscillator (also known as the Stochastic Indicator)
- How well it works varies from market to market. This indicator IS NOT a holy grail, no matter how many trading gurus promise you "the secret way to use stochastics" or "3 powerful stochastic strategies". There is no secret.
- Extreme stochastic readings can result in different things.
- Overbought readings can mean that the market is about to fall, or can mean that the market's upwards momentum is strong hence the market will rally even more. Which case turns out to be true differs from market to market.
- Oversold readings can mean that the market is about to rally, or can mean that the market's downwards momentum is strong hence the market will fall even more. Which case turns out to be true differs from market to market.
- In general, trading on the side of the market's long term trend is the best way to use stochastics. I.e. go long when the market is in an uptrend, has made a short term pullback and is oversold. This strategy works particularly well in markets that tend to trend higher over time such as the U.S. stock market (S&P 500).