
Stocks are hitting new highs, and with less greed

A less greedy high
Many sentiment indicators hit historic extremes of optimism in December and January. After stocks dipped in late January, sentiment reset. Now that they’ve moved to new highs, it’s being accompanied by less optimism.
The CNN Fear & Greed index is a model created by and published by CNN on their public website (we suggest you visit their site to learn more about the model). This is our calculation of the model based on the inputs discussed on their website. The model measures inputs such as price trend, volatility, options trading, and bond trading to determine prevailing investor sentiment.
It varies slightly from theirs since we use a slightly different bond index in order to calculate more than 20 years of history for the model.
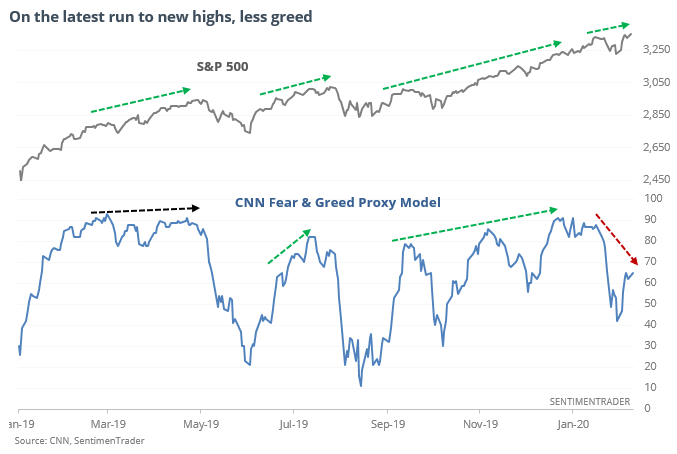
We looked for setups when the model exceeded 80 in the past month as stocks were hitting new highs, then stocks pulled back for at least a couple of weeks. On the next push to new highs, Greed was below 65.
This kind of behavior suggests less interest in chasing the latest round of high prices. Rising bullishness is a good thing, until it reaches an extreme. When it does reach that extreme and then we see less buying interest on subsequent pushes, it rarely turns out well.
Optimistic options traders
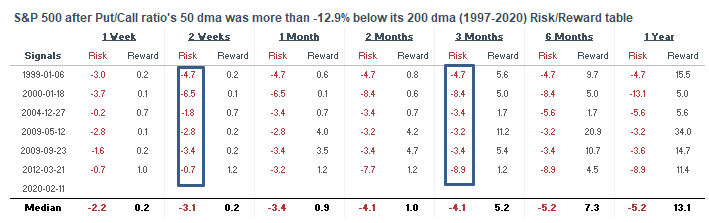
Sentiment was extremely optimistic in December and January. After a brief pullback a few weeks ago, the S&P has made new highs and sentiment is extremely optimistic again. The Total Put/Call ratio's 50 dma is almost -13% below its 200 dma, the most in 7 years.
Looking at the max drawdowns over the next 2 weeks - 3 months, all of the cases saw at least a -3% pullback from where the S&P is right now.
This is an abridged version of our recent reports and notes. For immediate access with no obligation, sign up for a 30-day free trial now.
We also looked at:
- What it means when the correlation between stocks and the 10-year Treasury yield is near record highs
- Over the past year, a large number of Hindenburg Omen warnings have triggered
- The S&P has set a near-record number of all-time highs over the past 4 months
- What happens when the Nasdaq 100 is so far above its 200-day moving average
- A lot of S&P 500 stocks are above their 200-day averages