
Stocks Haven't Done This For 7 Years

This is an abridged version of our recent reports and notes. For immediate access with no obligation, sign up for a 30-day free trial now.
There’s always tomorrow
Since early October, holders of the S&P 500 have not had to suffer back-to-back losses. It’s been 25 sessions since the S&P faced losses on consecutive days, its longest streak since 2012, one of the longest since 1998 - and even among the longest going all the way back to 1928.
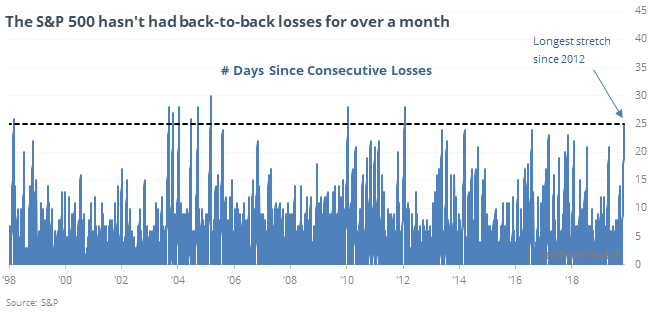
Most momentum-related studies show even more strength over the medium- to long-term (momentum does not die easily) but this one is much less conclusive. While it’s an impressive sign of momentum, it has not necessarily suggested an all-clear. Returns over the next 1-6 months were a bit weaker than random, especially the next month when the index added to its gains less than half the time.
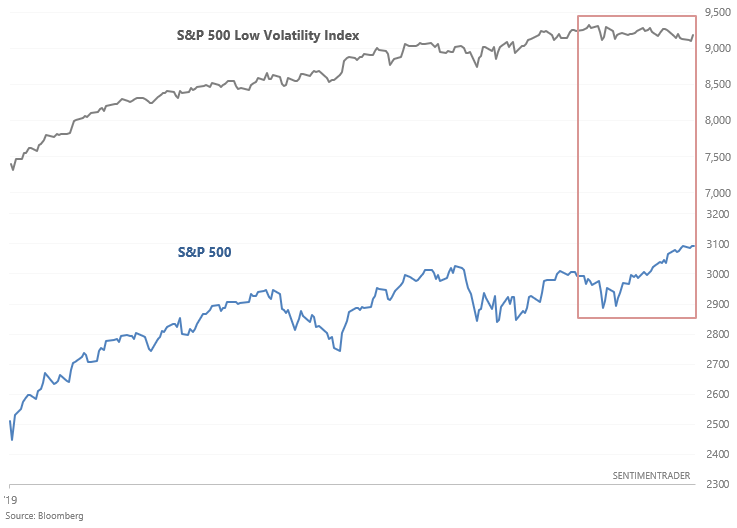
S&P 500 Low Volatility
Investors and traders have been shifting away from defensive assets over the past few weeks. As the WSJ noted, the S&P 500 Low Volatility Index (which had rallied nonstop earlier this year) has been stagnant over the past 2 months while the S&P 500 continues to rally.
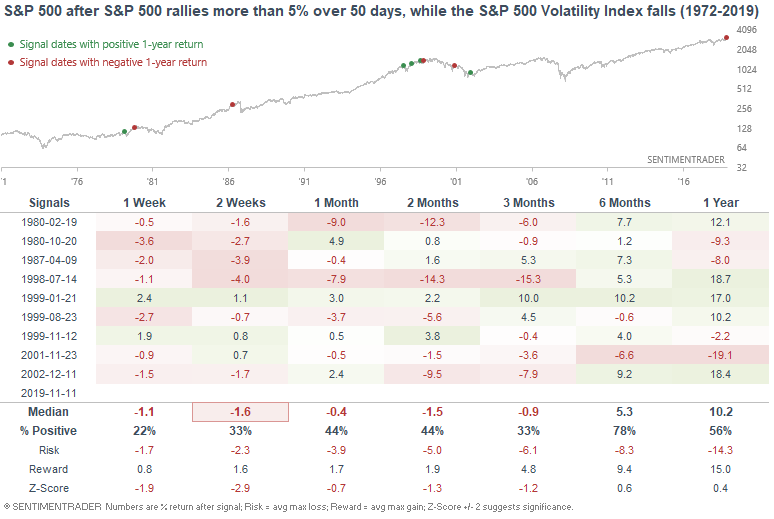
When the S&P 500 rallies more than 5% over a 50 day period, while the Low Volatility Index falls, the S&P 500 typically does poorly over the next few weeks
We also looked at:
- Bond boondoggle - BB-rate CLOs are diverging negatively with high yield bonds
- The OECD Composite Leading Indicator is plunging
- The SKEW index keeps rising
- NYSE Bullish % has eclipsed 60%
- Emerging markets just enjoyed a Golden Cross