
Stocks in the S&P 500 Are Now Showing a Breadth Thrust

At various points during the summer, there were odd stretches where indexes like the S&P 500 were pushing higher but with a troubling lack of participation.
Each time, the situations resolved by the indexes moving even higher. As they stumbled in September, though, there was a quick washout among stocks. By September 20, fewer than 10% of stocks in that index held above their 10-day moving averages.
Then buyers stepped in, and by the end of last week, more than 80% of members were trading above their averages, which is the largest amount in well over a month. This is a stark change in character.
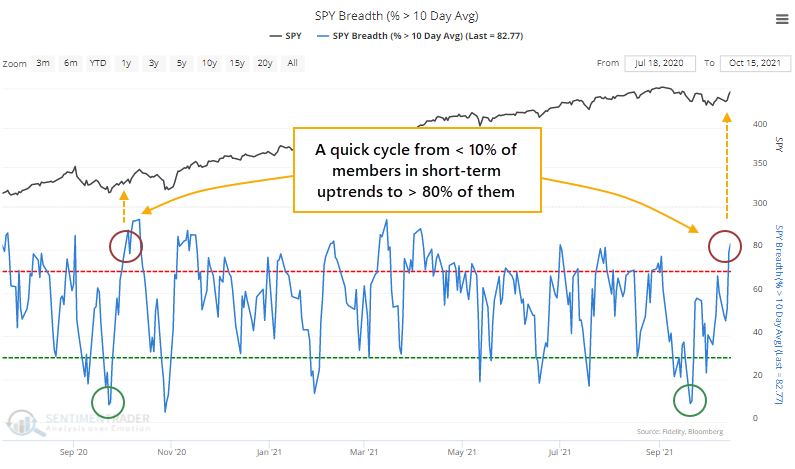
The only recent time we saw a similar move was almost exactly a year ago. That essentially marked the end of that corrective period.
IT'S A RARE EVENT WHEN STOCKS ARE NEAR THEIR HIGHS
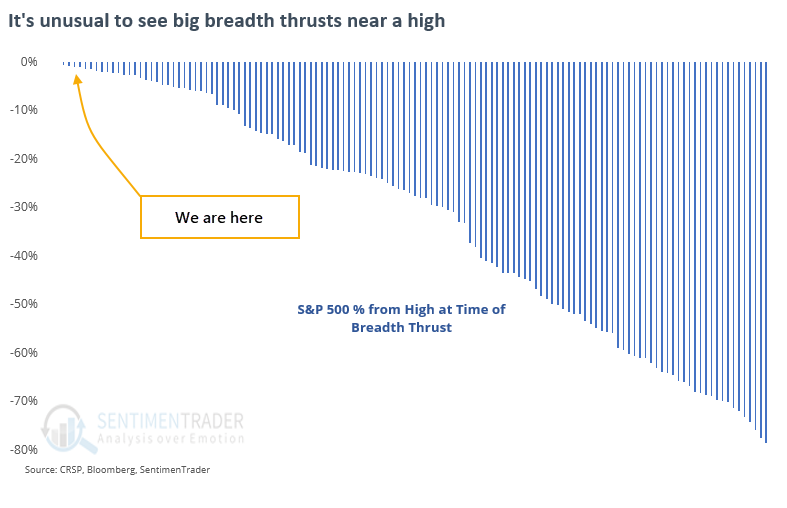
Typically, breadth swings like this during times of general market volatility. It's much rarer to see cycles from very low to very high figures within a few weeks of each other when stocks are trading near their highs.
When we go back to 1928 and look for times when fewer than 10% of S&P members were above their 10-day averages, then more than 80% of them were within a month, only a handful of signals triggered when the S&P was trading within 1.5% of a multi-year high. This is a highly unusual situation.
THRUSTS NEAR HIGHS LED TO MORE UPSIDE
Because it is so rare to see a thrust when the S&P was at or near a multi-year high, our sample size is limited if we look for the most comparable precedents.
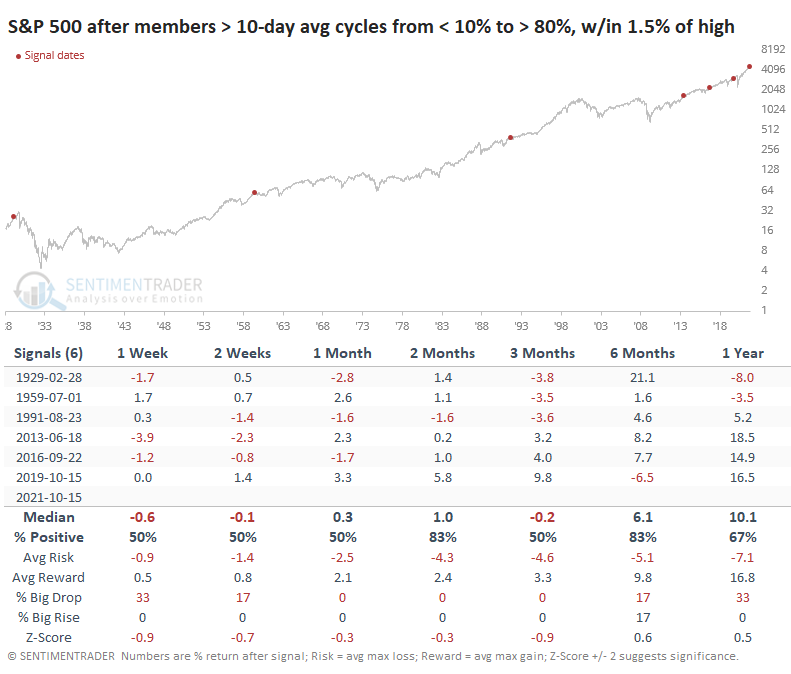
After the others, the S&P's returns mixed, oscillating around random. Perhaps most notably, none of them led to large sustained declines, at least for a long while. All of them showed a positive return either 3 or 6 months later.
The sample size almost triples if we look for times when the S&P was within 3% of its prior high (instead of 1.5%).
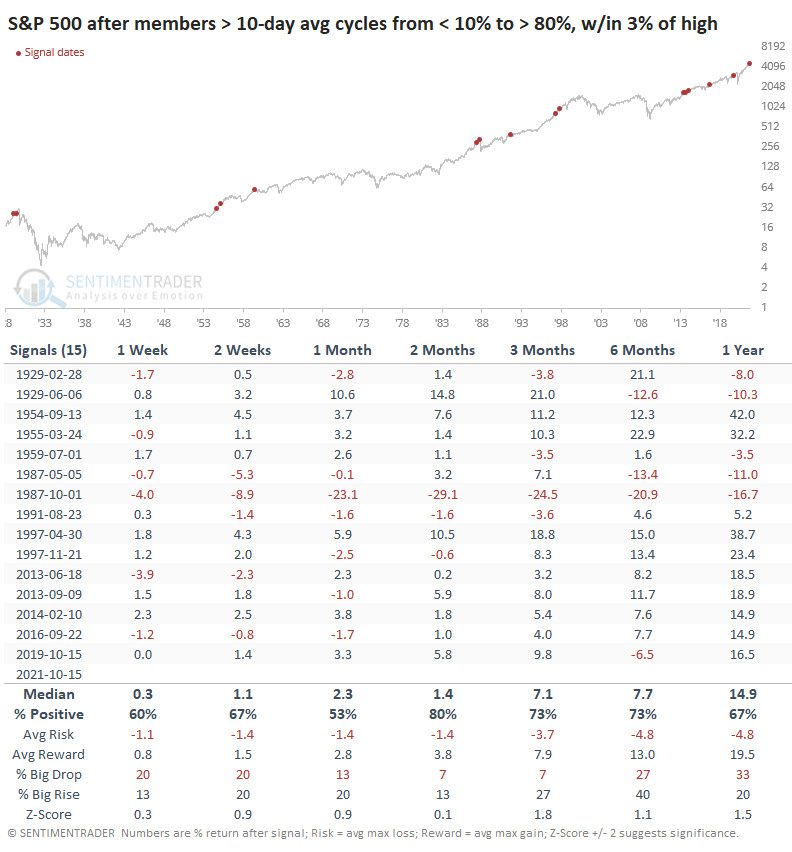
Here, the returns were better and still consistently positive over the medium term. There was a colossal failure when it signaled right before Black Monday in 1987, but that was the only time stocks saw more than a 1.6% loss over the next two months.
Returns after these signals were better than when they trigger coming out of a sustained decline, which was much more common. When the S&P was more than 20% from its peak, and we saw one of these thrusts, its future returns were okay but generally less than when the index was closer to a high.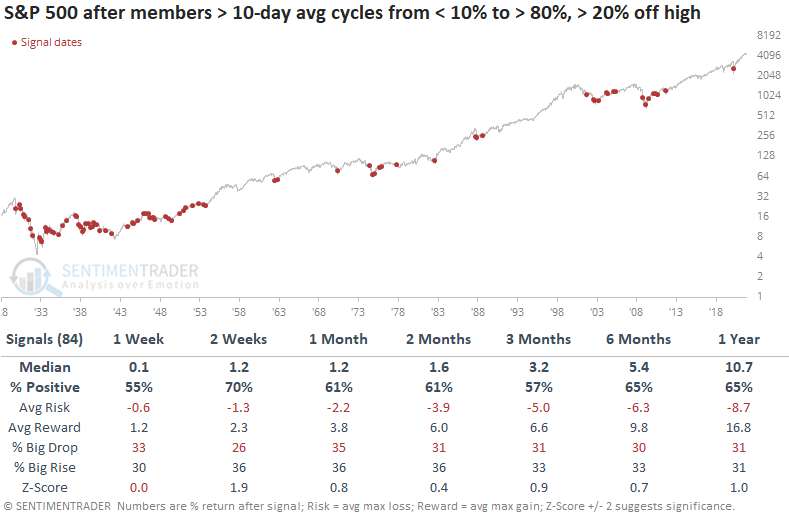
After suffering the most extended pullback in nearly a year, stocks have ended a long streak of positive price momentum. After it ended, that kind of momentum tended to bring in buyers, not sellers, and we see some signs of that lately. This thrust in short-term participation in the S&P and other indexes is a good sign as well.