
Stocks rally on lower volume as gold suffers dislocations

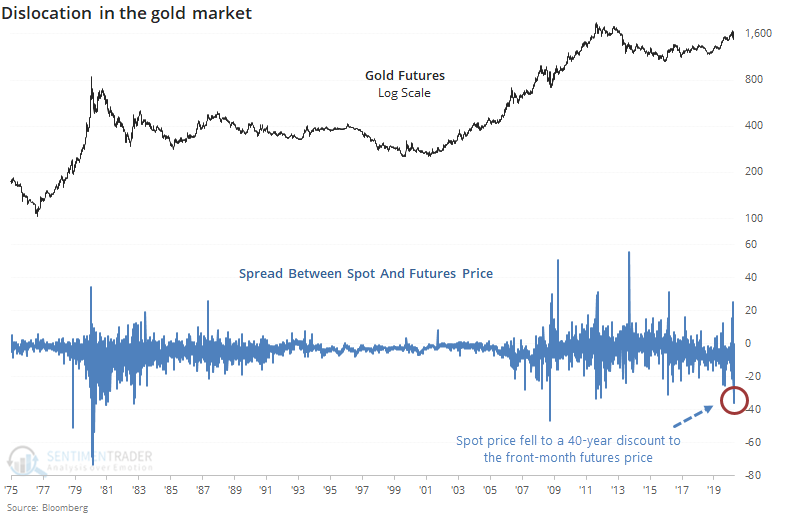
Gold market dislocation
There have been some odd, extreme moves in stocks over the past few weeks. And bonds, and currencies, and commodities. The forced selling in mid- to late-March triggered a lot of unusual trading activity and a breakdown in correlations.
One of those is that during times of duress in other markets, especially stocks, gold is supposed to be a safe haven. Yet it sold off along with stocks before recovering lately. That forced selling caused the spot price of gold to fall far below what futures traders were willing to pay.
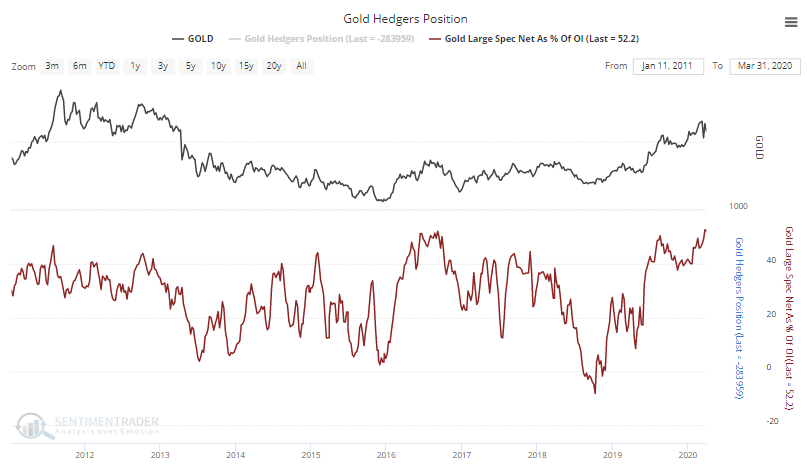
Large speculators have been scrambling to sell gold futures in recent weeks as the contract suffered volatility. Even though speculators have sold some of their their long positions, overall open interest in gold futures is plunging. That means their net position as a percentage of open interest has continued to climb as is now at a record high.
We also looked at gold's:
- Futures curve
- Total open interest trend
- Discounts in closed-end funds
- Hedge fund exposure
- Put/call skew
- Open interest ratio in GLD
- Fund flow in the GLD fund and mining stock funds GDX and GDXJ
- Seasonality
- Optimism Index
Low volume is not a worry
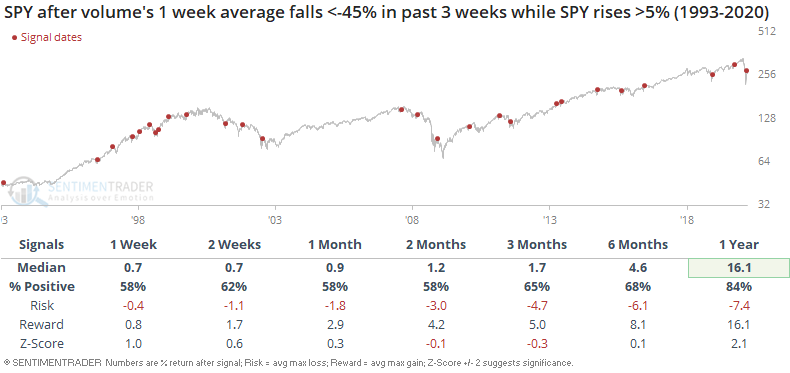
The U.S. stock market's rally since March 24 has been accompanied by falling volume. As is the case every time the market rallies and volume falls, people get worried. Volume always falls after a post-crash rally. It's neither bullish nor bearish - it just is.
For example, when SPY volume's 1 week average fell more than -45% over the past 3 weeks while SPY rallied +10%, the S&P rallied over the next year each time. This occurred after the crash of 1998, bear market of 2000-2002, and crash of 2018.
This normal (and somewhat bullish) phenomenon exists even if we relax the study's parameters to increase sample sizes. Once again, the S&P usually rallied over the next year.
This is an abridged version of our recent reports and notes. For immediate access with no obligation, sign up for a 30-day free trial now.
We also looked at:
- What happens when stocks give up big intraday gains in a negative reversal
- The Nasdaq 100 is pushing above its 200-day average after a big discount
- Rally volume patterns in IWM and QQQ
- What happens when the S&P, DAX, and energy sector rally from their lows
- The probability of a recession is pretty much 100%
- What it mean when the McClellan Oscillator becomes overbought
- We've seen a record stretch of 3% moves