
Stocks Struggle To Match The S&P

Don Quixote: Dost not see? A monstrous giant of infamous repute whom I intend to encounter.Sancho Panza: It's a windmill.
Don Quixote: A giant. Canst thou not see the four great arms whirling at his back?
Sancho Panza: A giant?
Don Quixote: Exactly.
Pointing out any weakness lately has been an exercise in tilting at windmills. We can see something that according to the final arbiter, price, simply does not exist.
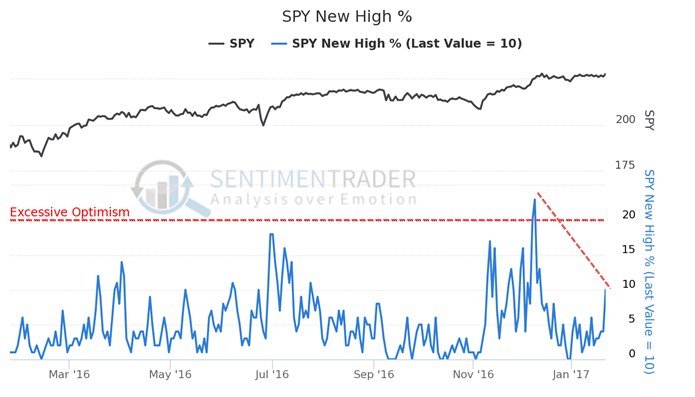
So like Don Quixote, let's keep plugging along for now. The final figures are in for Tuesday's push to new highs, and yet breadth continues to lag, even within the S&P 500 itself.
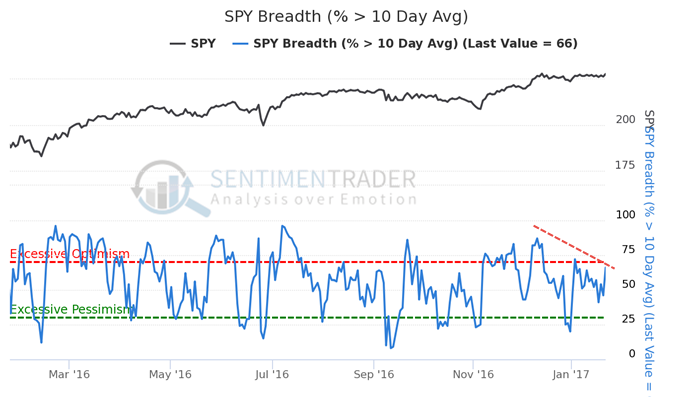
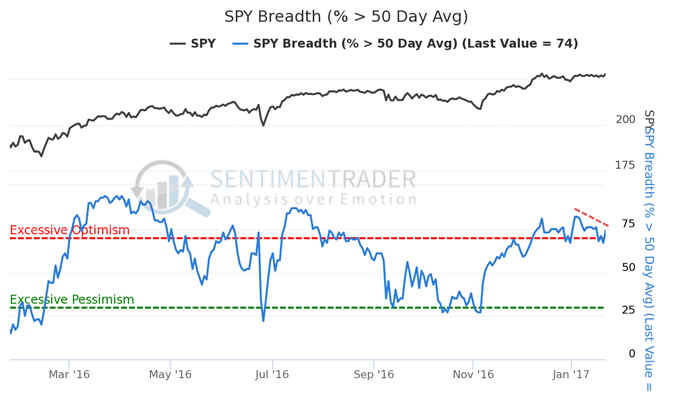
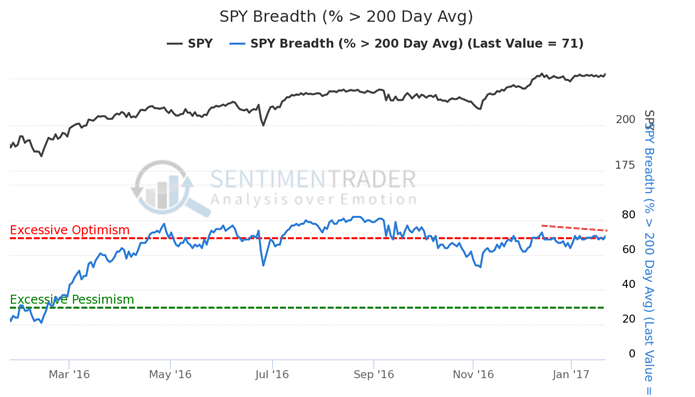
Looking at the percentage of S&P stocks above their 10-day, 50-day, and 200-day averages, fewer than 75% of them were above their averages. And fewer than 10% of the stocks made new 52-week highs along with the index itself.
 The last decade has been extremely strong for stocks (excluding 2008), so let's look at the past 10 years and consider any day when the S&P 500 index closed at a 52-week high but fewer than 75% of stocks were above their short-, medium-, and long-term averages, and fewer than 10% closed at a 52-week high.
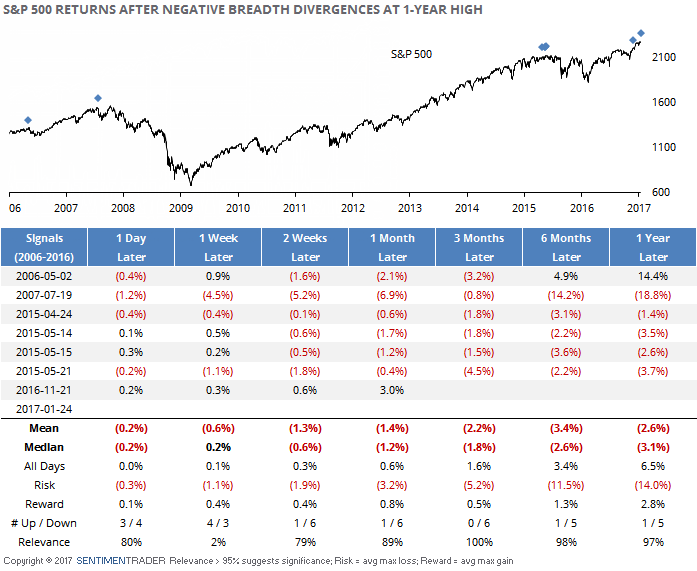
Even during this strong stretch, the few occurrences all led to meaningful weakness in the weeks and months ahead. The risk/reward was heavily skewed to the downside, with none of the occurrences traveling more than +1% over the next couple of weeks, while the average downside was nearly -2%. It got worse from there.
The biggest risk is simply that it doesn't matter, like what happened in 2013. There are many factors that are completely different now from what we saw then, but our bottom line is always that when our models and indicators fail in the shorter-term, it tells us something about the longer-term. And those shorter-term studies that had been suggesting weakness are on the verge of outright failure. We're still looking for these short-term gains to evaporate during a subsequent correction, but can't wait forever.