
Streak of highs beating lows finally ends

Ever since May 14, more securities on the NYSE have been hitting 52-week highs than 52-week lows. For the first time since then, more than 4 months, that changed with more lows than highs on Monday.
Below, we can see that when the net percentage of stocks at a 52-week low is greater than those at a 52-week high, the S&P 500 returned an annualized +3.9% versus +10.8% when this figure was positive.
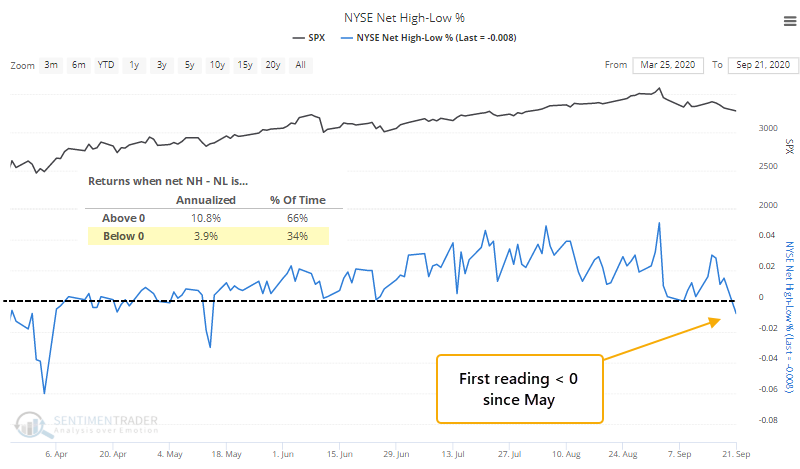
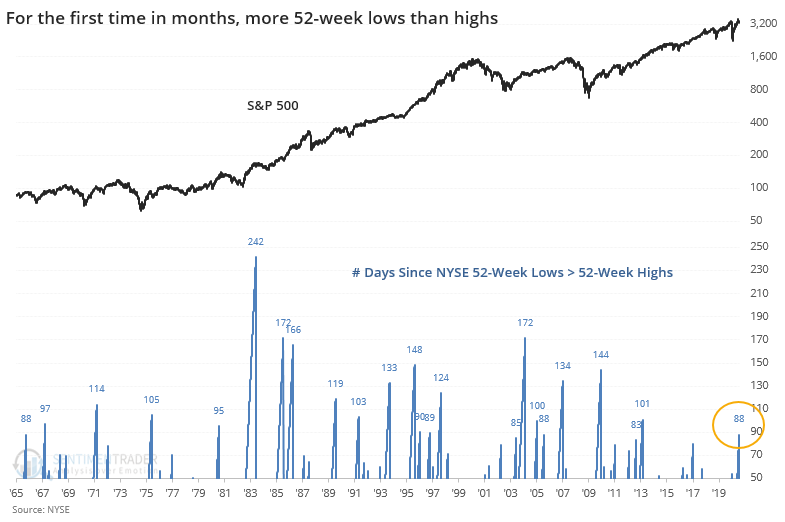
Monday's session ended a streak of nearly 90 days with a positive net number of 52-week extremes. That stopped one of the longer streaks in more than 50 years.
After other long streaks ended, the S&P struggled a bit short-term, with higher risk than reward, but showed good medium-term returns.
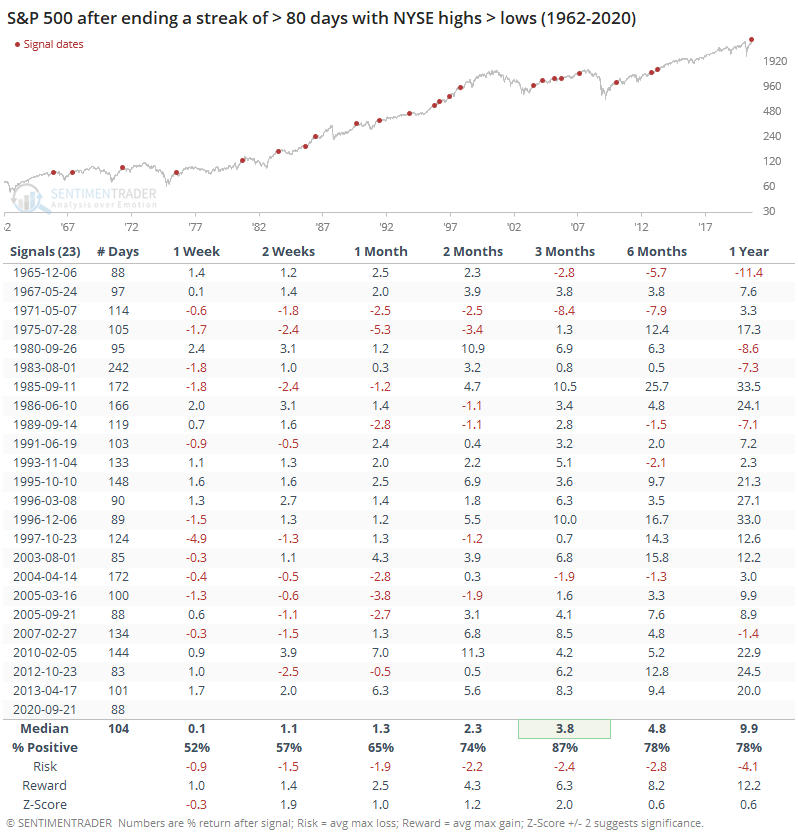
Over the next 3 months, the S&P returned a median +3.8%, well above a random 3-month return over the study period. There were only 3 losses out of the 23 signals, and 2 of those were less than -3%. The other loss was made up in the months ahead, so there were no true failures.
There are a lot of crosscurrents right now, which makes this a tricky juncture. Momentum has shifted and indexes have quickly fallen into a correction, or approximately so. There are still those pesky signs of supercharged speculation from options traders.
And yet when we've seen positive momentum as we have in recent months, especially in breadth statistics which can be more meaningful than just the price action of major indexes, future medium-term returns tended to be quite positive. This suggests that if we saw further short-term weakness, which would hopefully wring out some of those speculative juices, it should bring in those investors who missed some of the recent momentum.